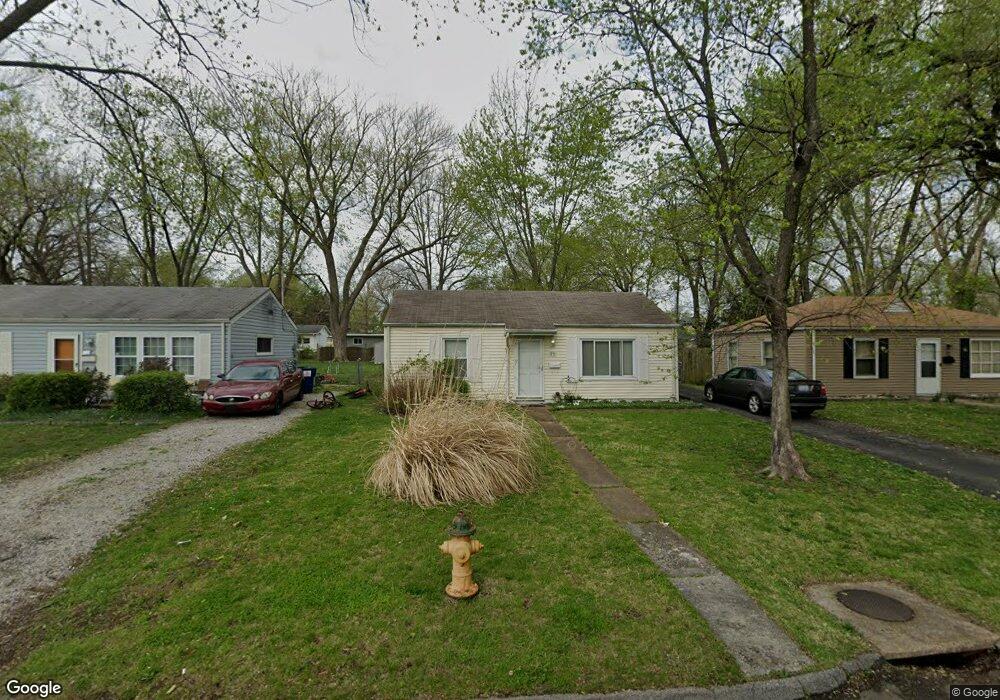
29 Rissant Dr Florissant, MO 63031
Estimated Value: $105,000 - $121,495
2
Beds
1
Bath
921
Sq Ft
$125/Sq Ft
Est. Value
About This Home
This home is located at 29 Rissant Dr, Florissant, MO 63031 and is currently estimated at $114,874, approximately $124 per square foot. 29 Rissant Dr is a home located in St. Louis County with nearby schools including Parker Road Elementary School, Cross Keys Middle School, and McCluer North High School.
Ownership History
Date
Name
Owned For
Owner Type
Purchase Details
Closed on
Jan 25, 2016
Sold by
Spinelli Jeffrey S and Spinelli Tammy
Bought by
Realty Quest Llc
Current Estimated Value
Purchase Details
Closed on
Jul 15, 2011
Sold by
Federal National Mortgage Association
Bought by
Spinelli Jeffrey S and Spinelli Tammy
Purchase Details
Closed on
Mar 21, 2011
Sold by
Barager Brian and Barager Christina
Bought by
Federal National Mortgage Association
Purchase Details
Closed on
May 13, 2005
Sold by
Barager Brian and Barager Christina
Bought by
Barager Brian and Barager Christina
Home Financials for this Owner
Home Financials are based on the most recent Mortgage that was taken out on this home.
Original Mortgage
$54,000
Interest Rate
6.37%
Mortgage Type
Stand Alone Refi Refinance Of Original Loan
Create a Home Valuation Report for This Property
The Home Valuation Report is an in-depth analysis detailing your home's value as well as a comparison with similar homes in the area
Home Values in the Area
Average Home Value in this Area
Purchase History
| Date | Buyer | Sale Price | Title Company |
|---|---|---|---|
| Realty Quest Llc | -- | None Available | |
| Spinelli Jeffrey S | $15,000 | Ctc | |
| Federal National Mortgage Association | $52,768 | None Available | |
| Barager Brian | -- | Titleamerica Inc |
Source: Public Records
Mortgage History
| Date | Status | Borrower | Loan Amount |
|---|---|---|---|
| Previous Owner | Barager Brian | $54,000 |
Source: Public Records
Tax History Compared to Growth
Tax History
| Year | Tax Paid | Tax Assessment Tax Assessment Total Assessment is a certain percentage of the fair market value that is determined by local assessors to be the total taxable value of land and additions on the property. | Land | Improvement |
|---|---|---|---|---|
| 2025 | $1,446 | $22,770 | $5,420 | $17,350 |
| 2024 | $1,446 | $18,430 | $2,450 | $15,980 |
| 2023 | $1,441 | $18,430 | $2,450 | $15,980 |
| 2022 | $1,223 | $13,680 | $3,100 | $10,580 |
| 2021 | $1,202 | $13,680 | $3,100 | $10,580 |
| 2020 | $1,004 | $11,570 | $3,100 | $8,470 |
| 2019 | $1,055 | $11,570 | $3,100 | $8,470 |
| 2018 | $1,024 | $10,030 | $2,050 | $7,980 |
| 2017 | $1,019 | $10,030 | $2,050 | $7,980 |
| 2016 | $1,079 | $10,370 | $2,430 | $7,940 |
| 2015 | $1,085 | $10,370 | $2,430 | $7,940 |
| 2014 | -- | $10,660 | $2,470 | $8,190 |
Source: Public Records
Map
Nearby Homes
- 37 Marquette Dr
- 1580 Queens Dr
- 1215 Pamela Dr
- 43 Saint Celeste Dr
- 13 Saint Celeste Dr
- 6 Redwood Dr
- 1415 Saint Jean St
- 1365 Saint Jean St
- 1205 Fox Run Dr
- 1148 Boone St
- 1545 Bluefield Dr
- 420 Humes Ln
- 220 Versailles Dr
- 2315 Bramble Ln
- 2375 Hummingbird Dr
- 865 Boone St
- 1090 Saint Joseph St
- 405 Wren Dr
- 849 Saint Ferdinand St
- 1480 Burning Tree Dr