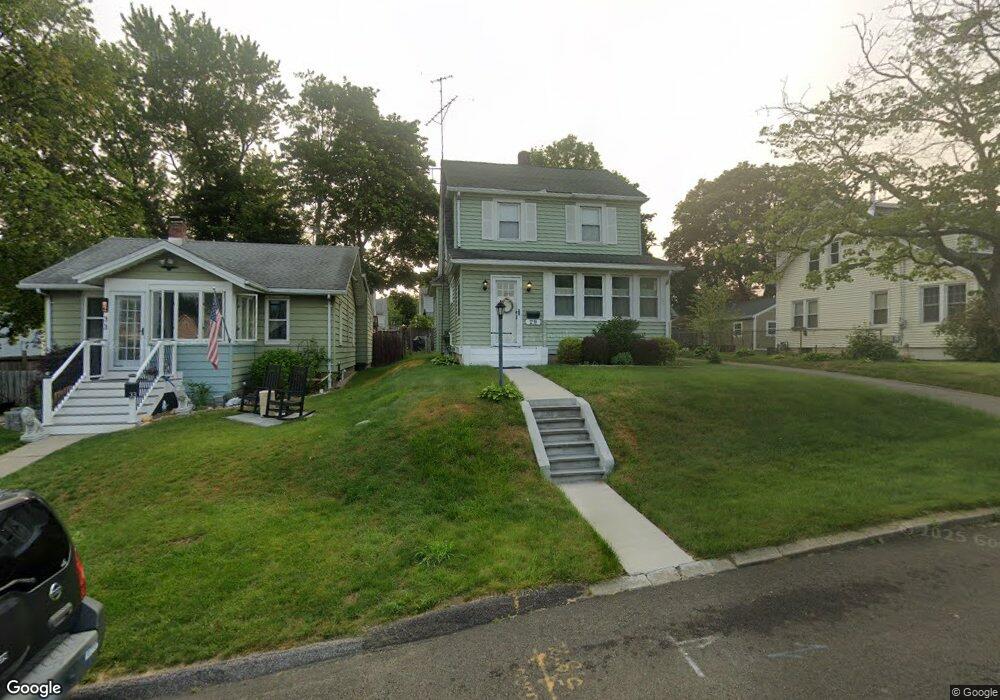
29 Robert St Milford, CT 06461
Devon NeighborhoodEstimated Value: $365,378 - $478,000
3
Beds
1
Bath
1,336
Sq Ft
$302/Sq Ft
Est. Value
About This Home
This home is located at 29 Robert St, Milford, CT 06461 and is currently estimated at $403,345, approximately $301 per square foot. 29 Robert St is a home located in New Haven County with nearby schools including J.F. Kennedy School, West Shore Middle School, and Jonathan Law High School.
Ownership History
Date
Name
Owned For
Owner Type
Purchase Details
Closed on
Jul 26, 2006
Sold by
Rutkowski Jeffrey
Bought by
Barrette Robert and Barrette Maureen
Current Estimated Value
Home Financials for this Owner
Home Financials are based on the most recent Mortgage that was taken out on this home.
Original Mortgage
$245,000
Outstanding Balance
$146,374
Interest Rate
6.67%
Estimated Equity
$256,971
Create a Home Valuation Report for This Property
The Home Valuation Report is an in-depth analysis detailing your home's value as well as a comparison with similar homes in the area
Home Values in the Area
Average Home Value in this Area
Purchase History
| Date | Buyer | Sale Price | Title Company |
|---|---|---|---|
| Barrette Robert | $245,000 | -- | |
| Rutkowski Jeffrey | $225,000 | -- | |
| Barrette Robert | $245,000 | -- |
Source: Public Records
Mortgage History
| Date | Status | Borrower | Loan Amount |
|---|---|---|---|
| Open | Barrette Robert | $245,000 | |
| Closed | Barrette Robert | $245,000 |
Source: Public Records
Tax History Compared to Growth
Tax History
| Year | Tax Paid | Tax Assessment Tax Assessment Total Assessment is a certain percentage of the fair market value that is determined by local assessors to be the total taxable value of land and additions on the property. | Land | Improvement |
|---|---|---|---|---|
| 2025 | $5,224 | $176,780 | $72,350 | $104,430 |
| 2024 | $5,151 | $176,780 | $72,350 | $104,430 |
| 2023 | $4,803 | $176,780 | $72,350 | $104,430 |
| 2022 | $4,711 | $176,780 | $72,350 | $104,430 |
| 2021 | $3,744 | $135,420 | $39,480 | $95,940 |
| 2020 | $3,748 | $135,420 | $39,480 | $95,940 |
| 2019 | $3,752 | $135,420 | $39,480 | $95,940 |
| 2018 | $3,757 | $135,420 | $39,480 | $95,940 |
| 2017 | $3,763 | $135,420 | $39,480 | $95,940 |
| 2016 | $4,039 | $145,070 | $39,480 | $105,590 |
| 2015 | $4,045 | $145,070 | $39,480 | $105,590 |
| 2014 | $3,949 | $145,070 | $39,480 | $105,590 |
Source: Public Records
Map
Nearby Homes