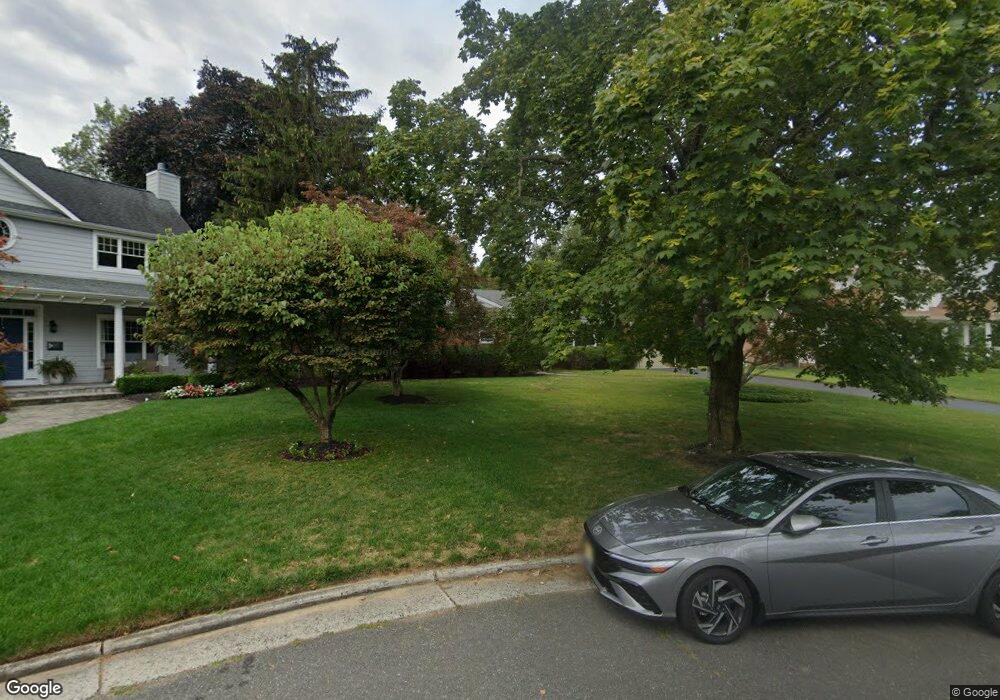
29 Robin Rd Rumson, NJ 07760
Estimated Value: $1,930,196 - $2,285,000
4
Beds
3
Baths
2,734
Sq Ft
$775/Sq Ft
Est. Value
About This Home
This home is located at 29 Robin Rd, Rumson, NJ 07760 and is currently estimated at $2,118,799, approximately $774 per square foot. 29 Robin Rd is a home located in Monmouth County with nearby schools including Deane Porter School, Forrestdale School, and Rumson Fair Haven Regional High School.
Ownership History
Date
Name
Owned For
Owner Type
Purchase Details
Closed on
Oct 2, 2012
Sold by
Fedun Theresa Martha Christina My
Bought by
Fedun Theresa Martha Christina My
Current Estimated Value
Purchase Details
Closed on
May 9, 2003
Sold by
Shanley Desmond
Bought by
Guerrero Richard and Gherrero Lauren
Home Financials for this Owner
Home Financials are based on the most recent Mortgage that was taken out on this home.
Original Mortgage
$400,000
Interest Rate
5.86%
Create a Home Valuation Report for This Property
The Home Valuation Report is an in-depth analysis detailing your home's value as well as a comparison with similar homes in the area
Home Values in the Area
Average Home Value in this Area
Purchase History
| Date | Buyer | Sale Price | Title Company |
|---|---|---|---|
| Fedun Theresa Martha Christina My | -- | None Available | |
| Guerrero Richard | $600,000 | -- |
Source: Public Records
Mortgage History
| Date | Status | Borrower | Loan Amount |
|---|---|---|---|
| Previous Owner | Guerrero Richard | $400,000 |
Source: Public Records
Tax History
| Year | Tax Paid | Tax Assessment Tax Assessment Total Assessment is a certain percentage of the fair market value that is determined by local assessors to be the total taxable value of land and additions on the property. | Land | Improvement |
|---|---|---|---|---|
| 2025 | $15,623 | $1,527,900 | $1,386,500 | $141,400 |
| 2024 | $15,604 | $1,420,300 | $1,291,700 | $128,600 |
| 2023 | $15,604 | $1,334,800 | $1,218,200 | $116,600 |
| 2022 | $13,083 | $1,179,300 | $1,069,700 | $109,600 |
| 2021 | $13,083 | $986,900 | $903,900 | $83,000 |
| 2020 | $14,430 | $1,007,000 | $917,200 | $89,800 |
| 2019 | $12,106 | $824,100 | $789,600 | $34,500 |
| 2018 | $12,189 | $822,500 | $789,600 | $32,900 |
| 2017 | $12,068 | $821,500 | $789,600 | $31,900 |
| 2016 | $11,761 | $820,700 | $789,600 | $31,100 |
| 2015 | $11,904 | $819,300 | $789,600 | $29,700 |
| 2014 | $11,926 | $818,500 | $789,600 | $28,900 |
Source: Public Records
Map
Nearby Homes
- 2 Tulip Tree Ln
- 143 Bingham Ave
- 61 Center St
- 132 Avenue of Two Rivers
- 24 Bingham Ct
- 13 Bingham Ct
- 11 Bingham Ct
- 26 Bingham Ct
- 14 Ridge Rd
- 12 Parmly St
- 121 Black Point Rd
- 22 Rosalie Ave
- 19 Maplewood Ave
- 18 Meadowbrook Ave
- 90 Washington St
- 94 Ridge Rd
- 80 Bingham Ave
- 7 Belknap Ln
- 39 E River Rd
- 50 Rumson Rd
Your Personal Tour Guide
Ask me questions while you tour the home.