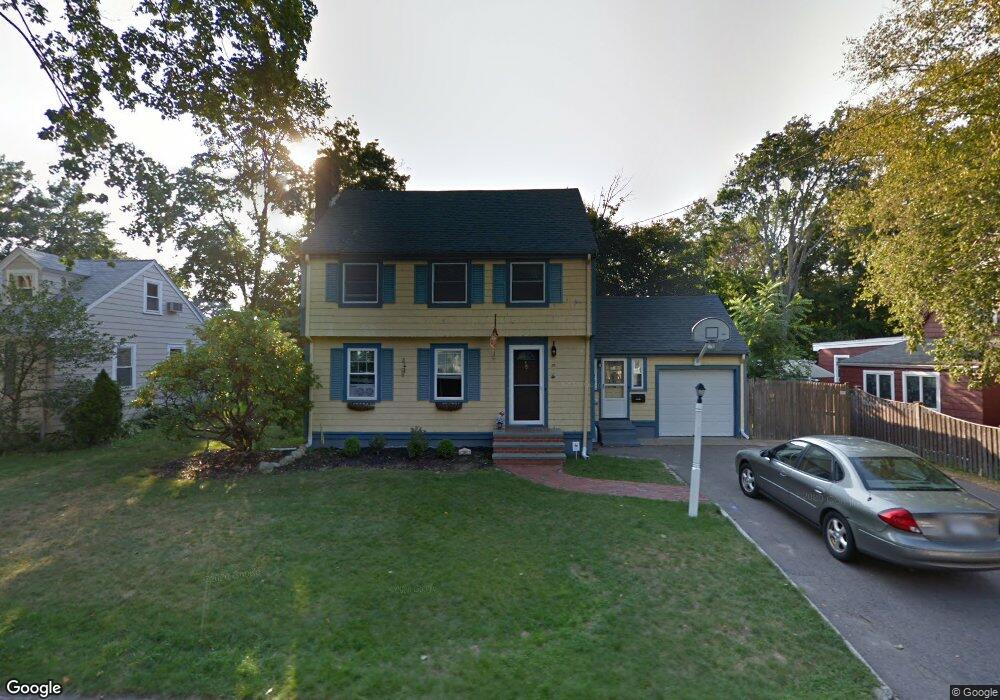
29 Russell Rd South Weymouth, MA 02190
South Weymouth NeighborhoodEstimated Value: $690,000 - $768,000
4
Beds
2
Baths
2,043
Sq Ft
$351/Sq Ft
Est. Value
About This Home
This home is located at 29 Russell Rd, South Weymouth, MA 02190 and is currently estimated at $716,131, approximately $350 per square foot. 29 Russell Rd is a home located in Norfolk County with nearby schools including Thomas W. Hamilton Primary School, Abigail Adams Middle School, and Weymouth Middle School Chapman.
Ownership History
Date
Name
Owned For
Owner Type
Purchase Details
Closed on
Oct 22, 2025
Sold by
Daley Michael T
Bought by
Michael T Daley T T and Michael Daley
Current Estimated Value
Purchase Details
Closed on
May 27, 2008
Sold by
Thompson Adam H and Thompson Danielle M
Bought by
Daley Michael T
Home Financials for this Owner
Home Financials are based on the most recent Mortgage that was taken out on this home.
Original Mortgage
$298,800
Interest Rate
5.94%
Mortgage Type
Purchase Money Mortgage
Purchase Details
Closed on
Nov 17, 2004
Sold by
Julian James R and Julian Susan E
Bought by
Thompson Adam H and Thompson Danielle M
Create a Home Valuation Report for This Property
The Home Valuation Report is an in-depth analysis detailing your home's value as well as a comparison with similar homes in the area
Home Values in the Area
Average Home Value in this Area
Purchase History
| Date | Buyer | Sale Price | Title Company |
|---|---|---|---|
| Michael T Daley T T | -- | -- | |
| Daley Michael T | $332,000 | -- | |
| Daley Michael T | $332,000 | -- | |
| Thompson Adam H | $420,000 | -- |
Source: Public Records
Mortgage History
| Date | Status | Borrower | Loan Amount |
|---|---|---|---|
| Previous Owner | Thompson Adam H | $296,000 | |
| Previous Owner | Thompson Adam H | $298,000 | |
| Previous Owner | Daley Michael T | $298,800 |
Source: Public Records
Tax History Compared to Growth
Tax History
| Year | Tax Paid | Tax Assessment Tax Assessment Total Assessment is a certain percentage of the fair market value that is determined by local assessors to be the total taxable value of land and additions on the property. | Land | Improvement |
|---|---|---|---|---|
| 2025 | $5,739 | $568,200 | $219,300 | $348,900 |
| 2024 | $5,540 | $539,400 | $208,900 | $330,500 |
| 2023 | $5,425 | $519,100 | $211,000 | $308,100 |
| 2022 | $5,288 | $461,400 | $195,400 | $266,000 |
| 2021 | $5,218 | $444,500 | $195,400 | $249,100 |
| 2020 | $5,011 | $420,400 | $195,400 | $225,000 |
| 2019 | $4,889 | $403,400 | $187,900 | $215,500 |
| 2018 | $4,734 | $378,700 | $178,900 | $199,800 |
| 2017 | $4,622 | $360,800 | $170,400 | $190,400 |
| 2016 | $4,443 | $347,100 | $163,900 | $183,200 |
| 2015 | $4,267 | $330,800 | $163,900 | $166,900 |
| 2014 | $4,087 | $307,300 | $152,500 | $154,800 |
Source: Public Records
Map
Nearby Homes
- 45 Union St
- 25 Wales Ave
- 102 White St
- 60 Greentree Ln Unit 38
- 18 Fountain Ln Unit 2
- 261 Pleasant St Unit 3
- 261 Pleasant St Unit 5
- 15 Ranger Cir
- 55 Greentree Ln Unit 19
- 299 Union St
- 27 Park Ave
- 17 Buchanan Ln
- 376 Pleasant St
- 7 Woodcrest Ct Unit 4
- 8 Woodcrest Ct Unit 4
- 11 Woodcrest Ct Unit 5
- 10 Woodcrest Ct Unit 4
- 50 Hollis St
- 120 Randolph St
- 110 Burkhall St Unit H