Estimated Value: $131,000 - $167,000
4
Beds
1
Bath
1,664
Sq Ft
$90/Sq Ft
Est. Value
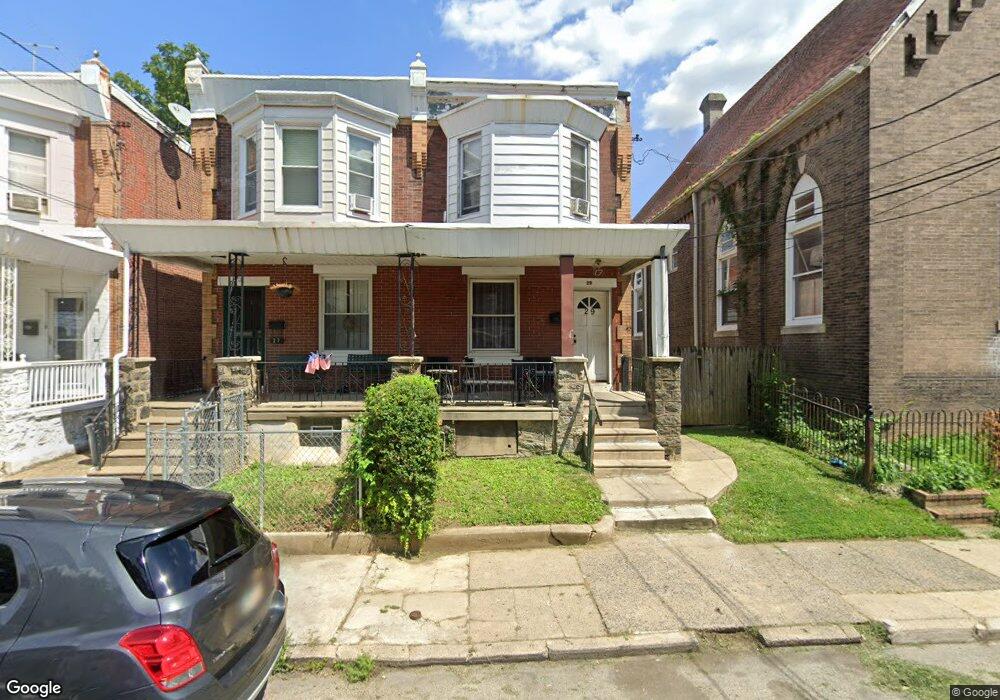
About This Home
This home is located at 29 S 3rd St, Darby, PA 19023 and is currently estimated at $150,002, approximately $90 per square foot. 29 S 3rd St is a home located in Delaware County with nearby schools including Walnut Street Elementary School, Penn Wood Middle School, and Penn Wood High School - Cypress Street Campus.
Ownership History
Date
Name
Owned For
Owner Type
Purchase Details
Closed on
Jun 29, 2016
Sold by
Baker Ameen
Bought by
Costantino Tyler
Current Estimated Value
Purchase Details
Closed on
Apr 6, 2005
Sold by
Burnside Edward A and Burnside Mary E
Bought by
Baker Ameen
Home Financials for this Owner
Home Financials are based on the most recent Mortgage that was taken out on this home.
Original Mortgage
$60,420
Interest Rate
8.45%
Mortgage Type
Fannie Mae Freddie Mac
Purchase Details
Closed on
Mar 10, 1999
Sold by
Burnside Edward A
Bought by
Burnside Edward A and Burnside Mary E
Home Financials for this Owner
Home Financials are based on the most recent Mortgage that was taken out on this home.
Original Mortgage
$48,000
Interest Rate
6.39%
Mortgage Type
Purchase Money Mortgage
Create a Home Valuation Report for This Property
The Home Valuation Report is an in-depth analysis detailing your home's value as well as a comparison with similar homes in the area
Home Values in the Area
Average Home Value in this Area
Purchase History
| Date | Buyer | Sale Price | Title Company |
|---|---|---|---|
| Costantino Tyler | $4,378 | None Available | |
| Baker Ameen | $63,600 | Fidelity Natl Title Ins Co | |
| Burnside Edward A | -- | Commonwealth Land Title Ins |
Source: Public Records
Mortgage History
| Date | Status | Borrower | Loan Amount |
|---|---|---|---|
| Previous Owner | Baker Ameen | $60,420 | |
| Previous Owner | Burnside Edward A | $48,000 |
Source: Public Records
Tax History
| Year | Tax Paid | Tax Assessment Tax Assessment Total Assessment is a certain percentage of the fair market value that is determined by local assessors to be the total taxable value of land and additions on the property. | Land | Improvement |
|---|---|---|---|---|
| 2025 | $2,083 | $40,000 | $17,300 | $22,700 |
| 2024 | $2,083 | $40,000 | $17,300 | $22,700 |
| 2023 | $1,278 | $40,000 | $17,300 | $22,700 |
| 2022 | $1,975 | $40,000 | $17,300 | $22,700 |
| 2021 | $2,732 | $40,000 | $17,300 | $22,700 |
| 2020 | $3,374 | $43,390 | $12,910 | $30,480 |
| 2019 | $3,326 | $43,390 | $12,910 | $30,480 |
| 2018 | $3,289 | $43,390 | $0 | $0 |
| 2017 | $3,234 | $43,390 | $0 | $0 |
| 2016 | $238 | $43,390 | $0 | $0 |
| 2015 | $243 | $43,390 | $0 | $0 |
| 2014 | $243 | $43,390 | $0 | $0 |
Source: Public Records
Map
Nearby Homes
Your Personal Tour Guide
Ask me questions while you tour the home.