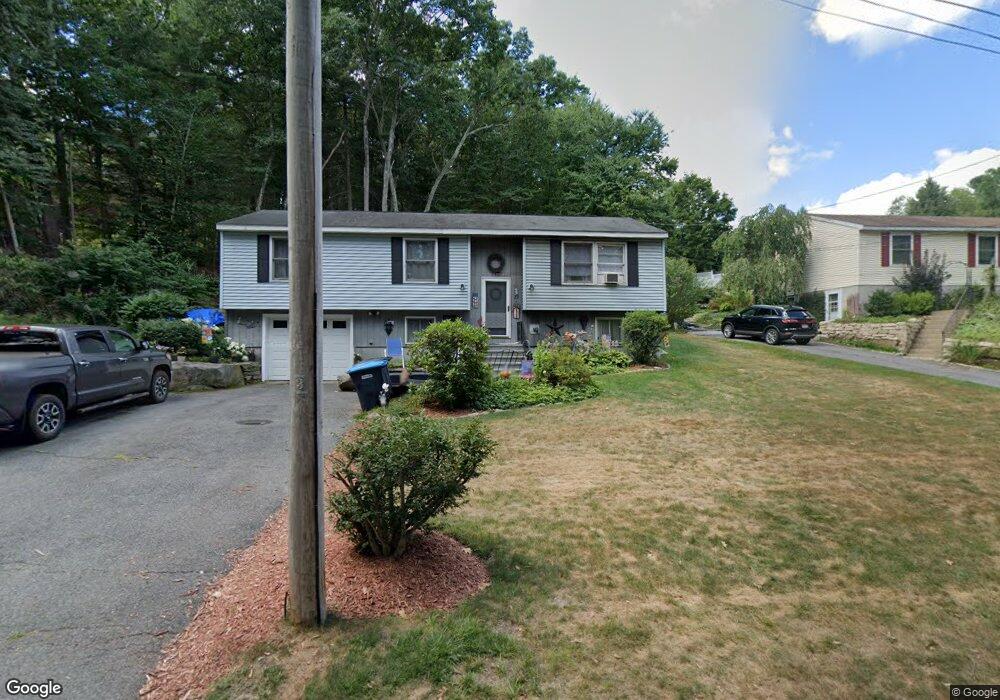
29 S Main St Unit 29 Northbridge, MA 01534
Estimated Value: $430,274 - $495,000
3
Beds
1
Bath
815
Sq Ft
$562/Sq Ft
Est. Value
About This Home
This home is located at 29 S Main St Unit 29, Northbridge, MA 01534 and is currently estimated at $457,819, approximately $561 per square foot. 29 S Main St Unit 29 is a home located in Worcester County with nearby schools including Northbridge Elementary School, Northbridge Middle School, and Northbridge High School.
Ownership History
Date
Name
Owned For
Owner Type
Purchase Details
Closed on
Oct 29, 1999
Sold by
Majeau Glenn R and Majeau Deborah A
Bought by
Hendriks Jan M
Current Estimated Value
Home Financials for this Owner
Home Financials are based on the most recent Mortgage that was taken out on this home.
Original Mortgage
$122,986
Interest Rate
7.78%
Mortgage Type
Purchase Money Mortgage
Create a Home Valuation Report for This Property
The Home Valuation Report is an in-depth analysis detailing your home's value as well as a comparison with similar homes in the area
Home Values in the Area
Average Home Value in this Area
Purchase History
| Date | Buyer | Sale Price | Title Company |
|---|---|---|---|
| Hendriks Jan M | $124,000 | -- | |
| Hendriks Jan M | $124,000 | -- |
Source: Public Records
Mortgage History
| Date | Status | Borrower | Loan Amount |
|---|---|---|---|
| Open | Hendriks Jan M | $166,000 | |
| Closed | Hendriks Jan M | $153,000 | |
| Closed | Hendriks Jan M | $122,986 |
Source: Public Records
Tax History Compared to Growth
Tax History
| Year | Tax Paid | Tax Assessment Tax Assessment Total Assessment is a certain percentage of the fair market value that is determined by local assessors to be the total taxable value of land and additions on the property. | Land | Improvement |
|---|---|---|---|---|
| 2025 | $4,287 | $363,600 | $140,400 | $223,200 |
| 2024 | $4,201 | $347,500 | $140,400 | $207,100 |
| 2023 | $4,345 | $335,300 | $140,400 | $194,900 |
| 2022 | $3,941 | $286,200 | $108,000 | $178,200 |
| 2021 | $3,802 | $262,400 | $102,800 | $159,600 |
| 2020 | $3,538 | $255,600 | $102,800 | $152,800 |
| 2019 | $3,205 | $247,100 | $102,800 | $144,300 |
| 2018 | $0 | $235,400 | $97,900 | $137,500 |
| 2017 | $3,047 | $225,200 | $97,900 | $127,300 |
| 2016 | $2,863 | $208,200 | $89,000 | $119,200 |
| 2015 | $2,786 | $208,200 | $89,000 | $119,200 |
| 2014 | $2,761 | $208,200 | $89,000 | $119,200 |
Source: Public Records
Map
Nearby Homes
- 1880 Providence Rd
- 1825 Quaker St
- 119 Susanne Dr
- 0 Puddon St
- 1540 Quaker St
- 369 Cooper Rd
- 557 Fowler Rd
- 73 Plummer Ave
- 135 Windstone Dr
- 306 Rumonoski Dr
- 1076 Hill St
- 2767 Providence Rd
- 89 Buttercup Ln Unit 255
- 86 Mikes Way Unit 86
- 86 Kingsnorth St
- 140 Rolling Ridge Dr Unit 78
- 169 Rolling Ridge Dr Unit 97
- 192 Rebecca Rd
- 19 Milford Rd
- 33 Crestwood Cir Unit 45
- 29 S Main St
- 35 S Main St
- 44 S Main St
- 13 Lovelace Ln
- 21 S Main St
- 64 S Main St
- 19 Lovelace Ln
- 0 S Main St
- 29 Lovelace Ln
- 5 S Main St
- 39 Lovelace Ln
- 49 S Main St
- 72 S Main St
- 67 S Main St
- 49 Lovelace Ln
- 15 Wallen Way
- 1843 Providence Rd
- 1861 Providence Rd Unit 1861
- 1861 Providence Rd
- 1861 Providence Rd Unit A