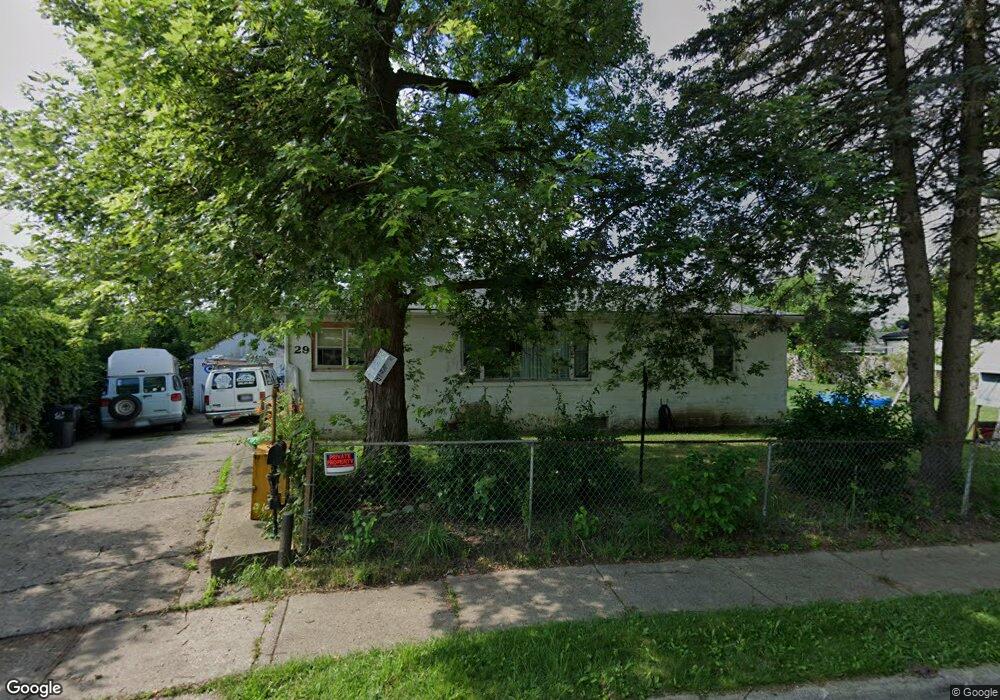
29 S Merrimac St Unit Bldg-Unit Pontiac, MI 48340
Estimated Value: $162,000 - $188,620
5
Beds
2
Baths
1,446
Sq Ft
$120/Sq Ft
Est. Value
About This Home
This home is located at 29 S Merrimac St Unit Bldg-Unit, Pontiac, MI 48340 and is currently estimated at $173,405, approximately $119 per square foot. 29 S Merrimac St Unit Bldg-Unit is a home located in Oakland County with nearby schools including Owen Elementary School, Pontiac Middle School, and Pontiac High School.
Ownership History
Date
Name
Owned For
Owner Type
Purchase Details
Closed on
Jul 30, 2024
Sold by
Newton Regina and Cedillo Regina S
Bought by
Cedillo Reymundo C and Cedillo Regina S
Current Estimated Value
Purchase Details
Closed on
Jan 30, 2019
Sold by
Lor Kia
Bought by
Newton Regina
Purchase Details
Closed on
Sep 11, 2013
Sold by
Lor Kevin
Bought by
Lor Kia
Purchase Details
Closed on
Feb 3, 2009
Sold by
Yang Willis E and Yang Michelle K
Bought by
Federal National Mortgage Association
Purchase Details
Closed on
Feb 8, 2005
Sold by
Yang Wade H and Yang Kiam
Bought by
Yang Willis E
Create a Home Valuation Report for This Property
The Home Valuation Report is an in-depth analysis detailing your home's value as well as a comparison with similar homes in the area
Home Values in the Area
Average Home Value in this Area
Purchase History
| Date | Buyer | Sale Price | Title Company |
|---|---|---|---|
| Cedillo Reymundo C | -- | None Listed On Document | |
| Newton Regina | $60,000 | None Available | |
| Lor Kia | -- | None Available | |
| Federal National Mortgage Association | $109,040 | None Available | |
| Yang Willis E | $135,000 | Cislo Title Company |
Source: Public Records
Tax History Compared to Growth
Tax History
| Year | Tax Paid | Tax Assessment Tax Assessment Total Assessment is a certain percentage of the fair market value that is determined by local assessors to be the total taxable value of land and additions on the property. | Land | Improvement |
|---|---|---|---|---|
| 2024 | $1,586 | $59,650 | $0 | $0 |
| 2023 | $1,512 | $53,280 | $0 | $0 |
| 2022 | $1,908 | $47,850 | $0 | $0 |
| 2021 | $1,966 | $41,670 | $0 | $0 |
| 2020 | $1,373 | $37,390 | $0 | $0 |
| 2019 | $837 | $32,410 | $0 | $0 |
| 2018 | $1,169 | $26,690 | $0 | $0 |
| 2017 | $1,120 | $25,500 | $0 | $0 |
| 2016 | $1,143 | $22,180 | $0 | $0 |
| 2015 | -- | $21,590 | $0 | $0 |
| 2014 | -- | $20,580 | $0 | $0 |
| 2011 | -- | $25,570 | $0 | $0 |
Source: Public Records
Map
Nearby Homes
- 32 N Merrimac St
- 141 Parkdale Ave
- 137 Dresden Ave
- 109 W Kennett Rd
- 119 W Kennett Rd
- 201 Parkdale Ave
- 54 Hudson Ave
- 33 W Beverly Ave
- 110 W Tennyson Ave
- 998 Dewey St
- 18 E 18 E Rutgers Ave
- 686 Lounsbury Ave
- 111 Hamilton St
- 709 Kinney Rd
- 0000 Blaine Ave
- 236 W Cornell Ave
- 134 W Fairmount Ave
- 123 Adelaide St
- 78 Cadillac St
- 117 W Strathmore Ave
- 29 S Merrimac St
- 41 S Merrimac St
- 26 S Merrimac St
- 45 S Merrimac St
- 747 Baldwin Ave
- 48 S Merrimac St
- 52 S Merrimac St
- 21 N Merrimac St
- 37 N Merrimac St
- 57 S Merrimac St
- 45 N Merrimac St
- 45 N Merrimac St
- 60 S Merrimac St
- 49 N Merrimac St
- 65 S Merrimac St
- 64 S Merrimac St
- 36 N Merrimac St
- 61 N Merrimac St
- 61 N Merrimac St
- 24 N Merrimac St