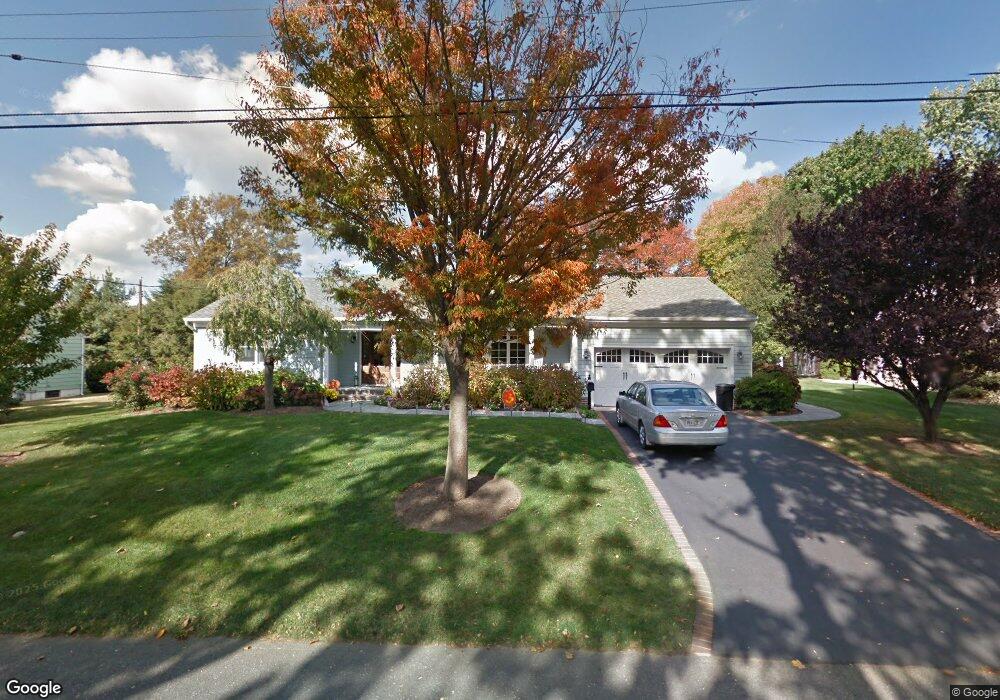
29 Sagamore Ave Oceanport, NJ 07757
Estimated Value: $882,000 - $1,082,000
3
Beds
3
Baths
1,569
Sq Ft
$617/Sq Ft
Est. Value
About This Home
This home is located at 29 Sagamore Ave, Oceanport, NJ 07757 and is currently estimated at $967,842, approximately $616 per square foot. 29 Sagamore Ave is a home located in Monmouth County with nearby schools including Wolf Hill Elementary School, Maple Place Elementary and Middle School, and Shore Regional High School.
Ownership History
Date
Name
Owned For
Owner Type
Purchase Details
Closed on
Feb 19, 2013
Sold by
Delcamp Emily J and Delcamp Barbara A
Bought by
Delcamp Emily J and Delcamp Barbara A
Current Estimated Value
Purchase Details
Closed on
Mar 20, 2012
Sold by
Verderese Robert A and Gryson Verderese Mary L
Bought by
Delcamp Emily J and Delcamp Barbara A
Purchase Details
Closed on
Aug 28, 2008
Sold by
Gryson Mary L
Bought by
Verderese Robert A and Verderese Mary L Gryson
Home Financials for this Owner
Home Financials are based on the most recent Mortgage that was taken out on this home.
Original Mortgage
$175,000
Interest Rate
6.57%
Mortgage Type
New Conventional
Purchase Details
Closed on
Jul 6, 2006
Sold by
Gryson Mary L
Bought by
Grayson Mary L
Purchase Details
Closed on
Oct 31, 2001
Sold by
Gryson Peter
Bought by
Gryson Mary and Gryson Maureen
Home Financials for this Owner
Home Financials are based on the most recent Mortgage that was taken out on this home.
Original Mortgage
$200,000
Interest Rate
6.67%
Create a Home Valuation Report for This Property
The Home Valuation Report is an in-depth analysis detailing your home's value as well as a comparison with similar homes in the area
Home Values in the Area
Average Home Value in this Area
Purchase History
| Date | Buyer | Sale Price | Title Company |
|---|---|---|---|
| Delcamp Emily J | -- | None Available | |
| Delcamp Emily J | $550,000 | Red Bank Title Agency Inc | |
| Verderese Robert A | -- | Accurate Land Title Agency I | |
| Grayson Mary L | $456,000 | -- | |
| Gryson Mary | $250,000 | -- |
Source: Public Records
Mortgage History
| Date | Status | Borrower | Loan Amount |
|---|---|---|---|
| Previous Owner | Verderese Robert A | $175,000 | |
| Previous Owner | Gryson Mary | $200,000 |
Source: Public Records
Tax History Compared to Growth
Tax History
| Year | Tax Paid | Tax Assessment Tax Assessment Total Assessment is a certain percentage of the fair market value that is determined by local assessors to be the total taxable value of land and additions on the property. | Land | Improvement |
|---|---|---|---|---|
| 2025 | $11,340 | $770,600 | $440,000 | $330,600 |
| 2024 | $11,605 | $718,200 | $402,000 | $316,200 |
| 2023 | $11,605 | $697,400 | $397,000 | $300,400 |
| 2022 | $10,830 | $611,500 | $347,000 | $264,500 |
| 2021 | $10,830 | $568,500 | $317,000 | $251,500 |
| 2020 | $10,003 | $547,200 | $300,000 | $247,200 |
| 2019 | $9,520 | $528,600 | $290,000 | $238,600 |
| 2018 | $9,405 | $525,700 | $290,000 | $235,700 |
| 2017 | $9,409 | $436,200 | $173,000 | $263,200 |
| 2016 | $9,391 | $438,200 | $180,000 | $258,200 |
| 2015 | $8,951 | $431,600 | $180,000 | $251,600 |
| 2014 | $8,452 | $413,300 | $190,000 | $223,300 |
Source: Public Records
Map
Nearby Homes
- 15 Signal Ave
- 8 Pocahontas Ave
- 66 Shrewsbury Ave
- 13 Morris Place
- 28 Patten Ln
- 580 Patten Ave Unit 48
- 580 Patten Ave Unit 62
- 580 Patten Ave Unit 86
- 580 Patten Ave Unit 31
- 3 Foggia Way
- 165 Kingsley St
- 16 Shore Dr
- 392 Florence Ave
- 164 Airsdale Ave
- 15 Airsdale Ave
- 222 Coleman Ave
- 10 Asbury Ave
- 154 Atlantic Ave
- 190 Spruce St Unit 4
- 323 Florence Ave
- 25 Sagamore Ave
- 31 Sagamore Ave Unit 33
- 66 Monmouth Blvd
- 64 Monmouth Blvd
- 26 Sagamore Ave
- 72 Monmouth Blvd
- 58 Monmouth Blvd
- 32 Sagamore Ave
- 19 Sagamore Ave
- 39 Sagamore Ave
- 74 Monmouth Blvd
- 3 Iroquois Ave
- 54 Monmouth Blvd
- 36 Sagamore Ave
- 64 Tohicon Place
- 60 Tohicon Place
- 7 Iroquois Ave
- 78 Monmouth Blvd
- 15 Sagamore Ave
- 16 Sagamore Ave