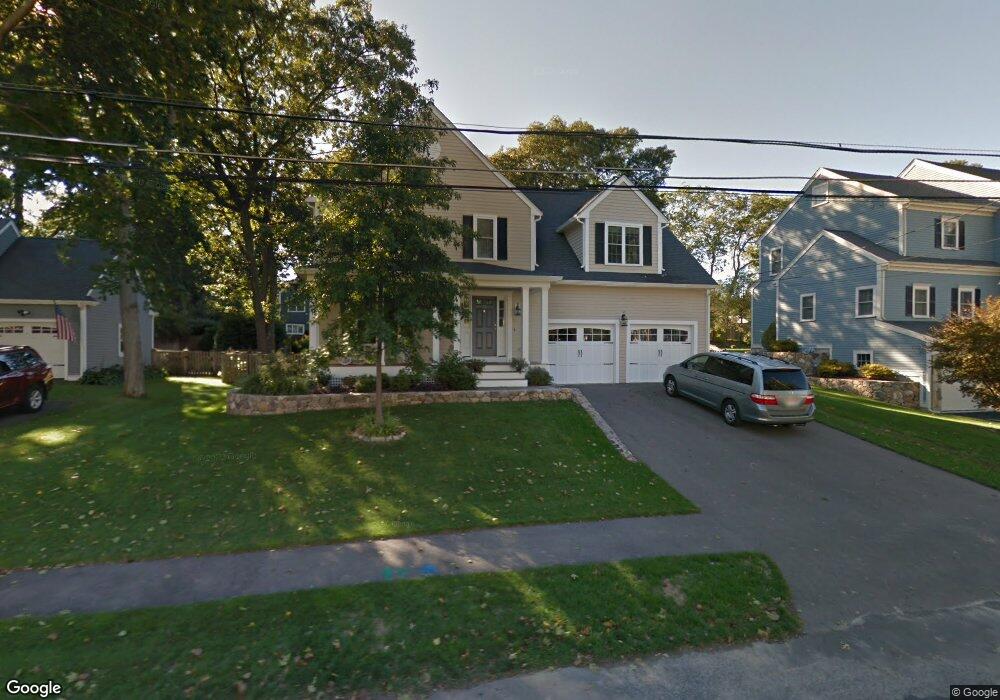
29 Savoy Rd Needham, MA 02492
Estimated Value: $1,237,000 - $2,109,947
4
Beds
3
Baths
1,192
Sq Ft
$1,513/Sq Ft
Est. Value
About This Home
This home is located at 29 Savoy Rd, Needham, MA 02492 and is currently estimated at $1,803,737, approximately $1,513 per square foot. 29 Savoy Rd is a home located in Norfolk County with nearby schools including Mitchell Elementary School, High Rock Middle School, and Pollard Middle School.
Ownership History
Date
Name
Owned For
Owner Type
Purchase Details
Closed on
Sep 18, 2007
Sold by
Piersiak Thomas and Piersiak Ons I
Bought by
Pitt Brian D and Kipp Katrina Vt
Current Estimated Value
Home Financials for this Owner
Home Financials are based on the most recent Mortgage that was taken out on this home.
Original Mortgage
$300,000
Interest Rate
6.7%
Mortgage Type
Purchase Money Mortgage
Purchase Details
Closed on
Mar 22, 2007
Sold by
Piersiak Heather V N and Piersiak William J
Bought by
Piersiak Thomas and Piersiak Ons I
Home Financials for this Owner
Home Financials are based on the most recent Mortgage that was taken out on this home.
Original Mortgage
$932,000
Interest Rate
6.33%
Mortgage Type
Purchase Money Mortgage
Purchase Details
Closed on
Jun 6, 2001
Sold by
Burns Kathleen
Bought by
Piersiak William J
Home Financials for this Owner
Home Financials are based on the most recent Mortgage that was taken out on this home.
Original Mortgage
$292,000
Interest Rate
7.08%
Mortgage Type
Purchase Money Mortgage
Create a Home Valuation Report for This Property
The Home Valuation Report is an in-depth analysis detailing your home's value as well as a comparison with similar homes in the area
Home Values in the Area
Average Home Value in this Area
Purchase History
| Date | Buyer | Sale Price | Title Company |
|---|---|---|---|
| Pitt Brian D | $1,022,000 | -- | |
| Piersiak Thomas | $540,000 | -- | |
| Piersiak William J | $370,000 | -- |
Source: Public Records
Mortgage History
| Date | Status | Borrower | Loan Amount |
|---|---|---|---|
| Open | Piersiak William J | $260,000 | |
| Closed | Pitt Brian D | $300,000 | |
| Previous Owner | Piersiak Thomas | $932,000 | |
| Previous Owner | Piersiak William J | $292,000 |
Source: Public Records
Tax History
| Year | Tax Paid | Tax Assessment Tax Assessment Total Assessment is a certain percentage of the fair market value that is determined by local assessors to be the total taxable value of land and additions on the property. | Land | Improvement |
|---|---|---|---|---|
| 2025 | $19,306 | $1,821,300 | $800,400 | $1,020,900 |
| 2024 | $16,677 | $1,332,000 | $589,200 | $742,800 |
| 2023 | $16,518 | $1,266,700 | $589,200 | $677,500 |
| 2022 | $15,631 | $1,169,100 | $521,400 | $647,700 |
| 2021 | $15,233 | $1,169,100 | $521,400 | $647,700 |
| 2020 | $14,623 | $1,170,800 | $521,400 | $649,400 |
| 2019 | $13,819 | $1,115,300 | $474,000 | $641,300 |
| 2018 | $13,250 | $1,115,300 | $474,000 | $641,300 |
| 2017 | $12,254 | $1,030,600 | $474,000 | $556,600 |
| 2016 | $11,893 | $1,030,600 | $474,000 | $556,600 |
| 2015 | $11,635 | $1,030,600 | $474,000 | $556,600 |
| 2014 | $10,809 | $928,600 | $395,000 | $533,600 |
Source: Public Records
Map
Nearby Homes
- 68 Brookline St
- 176 Highgate St
- 190 Brookline St
- 17 Lindbergh Ave
- 31 Birds Hill Ave
- 638 Webster St
- 638 Webster St Unit 638
- 36 Otis St Unit 36
- 883 Greendale Ave
- 510 Webster St
- 126 Prince St
- 143 Hunting Rd
- 60 Douglas Rd
- 40 High St
- 5 Hazel Ln
- 24 Mellen St
- 7 West St
- 100 Bradford St
- 58 Morton St
- 28 Green St
Your Personal Tour Guide
Ask me questions while you tour the home.