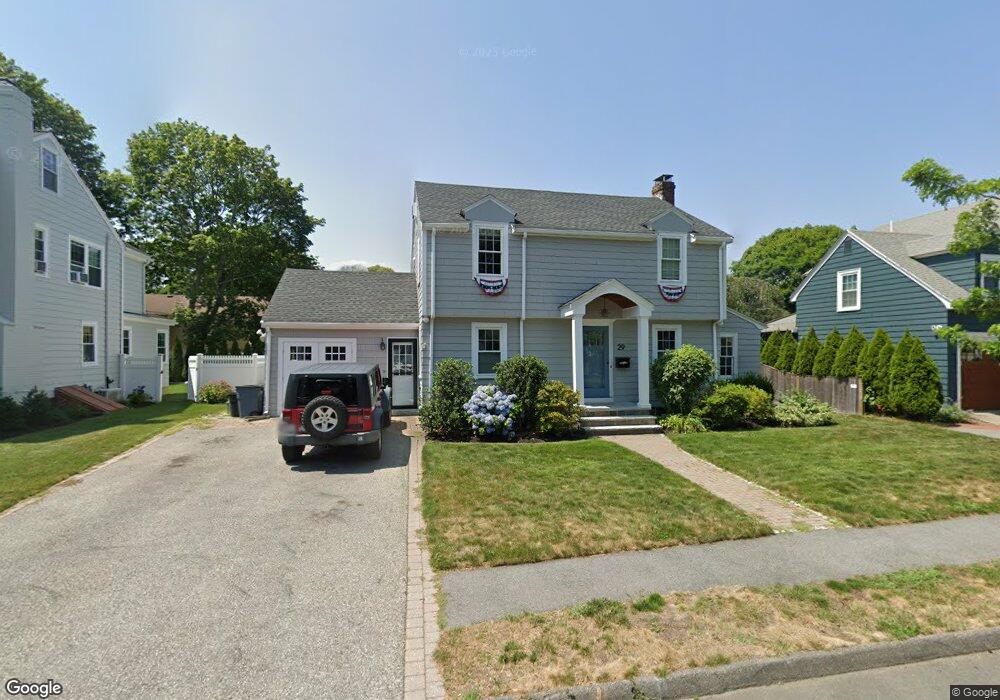
29 Sevinor Rd Marblehead, MA 01945
Estimated Value: $831,000 - $1,090,000
3
Beds
2
Baths
1,577
Sq Ft
$605/Sq Ft
Est. Value
About This Home
This home is located at 29 Sevinor Rd, Marblehead, MA 01945 and is currently estimated at $954,062, approximately $604 per square foot. 29 Sevinor Rd is a home located in Essex County with nearby schools including Marblehead High School, Tower School, and Devereux School.
Ownership History
Date
Name
Owned For
Owner Type
Purchase Details
Closed on
Feb 26, 2010
Sold by
Clayman Robert P and Clayman Sally J
Bought by
Elmer Robert M and Elmer Kara F
Current Estimated Value
Home Financials for this Owner
Home Financials are based on the most recent Mortgage that was taken out on this home.
Original Mortgage
$292,000
Interest Rate
5.11%
Mortgage Type
Purchase Money Mortgage
Purchase Details
Closed on
May 18, 1992
Sold by
Pincus Morris C and Pincus Elaine T
Bought by
Clayman Robert P and Clayman Sally
Create a Home Valuation Report for This Property
The Home Valuation Report is an in-depth analysis detailing your home's value as well as a comparison with similar homes in the area
Home Values in the Area
Average Home Value in this Area
Purchase History
We collect this data history from publicly available records. To have your information removed, we recommend requesting removal directly through your county’s website.
| Date | Buyer | Sale Price | Title Company |
|---|---|---|---|
| Elmer Robert M | $364,237 | -- | |
| Elmer Robert M | $364,237 | -- | |
| Clayman Robert P | $172,000 | -- | |
| Clayman Robert P | $172,000 | -- |
Source: Public Records
Mortgage History
We collect this data history from publicly available records. To have your information removed, we recommend requesting removal directly through your county’s website.
| Date | Status | Borrower | Loan Amount |
|---|---|---|---|
| Open | Clayman Robert P | $326,000 | |
| Closed | Clayman Robert P | $292,000 |
Source: Public Records
Tax History
| Year | Tax Paid | Tax Assessment Tax Assessment Total Assessment is a certain percentage of the fair market value that is determined by local assessors to be the total taxable value of land and additions on the property. | Land | Improvement |
|---|---|---|---|---|
| 2025 | $7,541 | $833,300 | $538,600 | $294,700 |
| 2024 | $7,496 | $836,600 | $550,500 | $286,100 |
| 2023 | $7,157 | $715,700 | $484,700 | $231,000 |
| 2022 | $6,917 | $657,500 | $430,800 | $226,700 |
| 2021 | $6,572 | $630,700 | $406,900 | $223,800 |
| 2020 | $6,101 | $587,200 | $406,900 | $180,300 |
| 2019 | $5,849 | $544,600 | $371,000 | $173,600 |
| 2018 | $5,738 | $520,700 | $347,100 | $173,600 |
| 2017 | $5,601 | $508,700 | $335,100 | $173,600 |
| 2016 | $5,381 | $484,800 | $311,200 | $173,600 |
| 2015 | $4,832 | $436,100 | $263,300 | $172,800 |
| 2014 | $4,394 | $396,200 | $239,400 | $156,800 |
Source: Public Records
Map
Nearby Homes
- 26 Pickwick Rd
- 9 Cedar St
- 18 Pickwick Rd
- 30 Shetland Rd
- 26 Cedar St Unit 2
- 25 Countryside Ln
- 6 Shetland Rd
- 19 Humphrey St
- 18 Rose Ave
- 2 Rolleston Rd
- 8 Charlotte Rd
- 53 Gerald Rd
- 411 Atlantic Ave Unit 2
- 282 Pleasant St
- 82 Cornell Rd
- 212 Humphrey St Unit 202
- 16 Preston Beach Rd
- 11 Angenica Terrace
- 28 Orchard St
- 21 Leggs Hill Rd
Your Personal Tour Guide
Ask me questions while you tour the home.