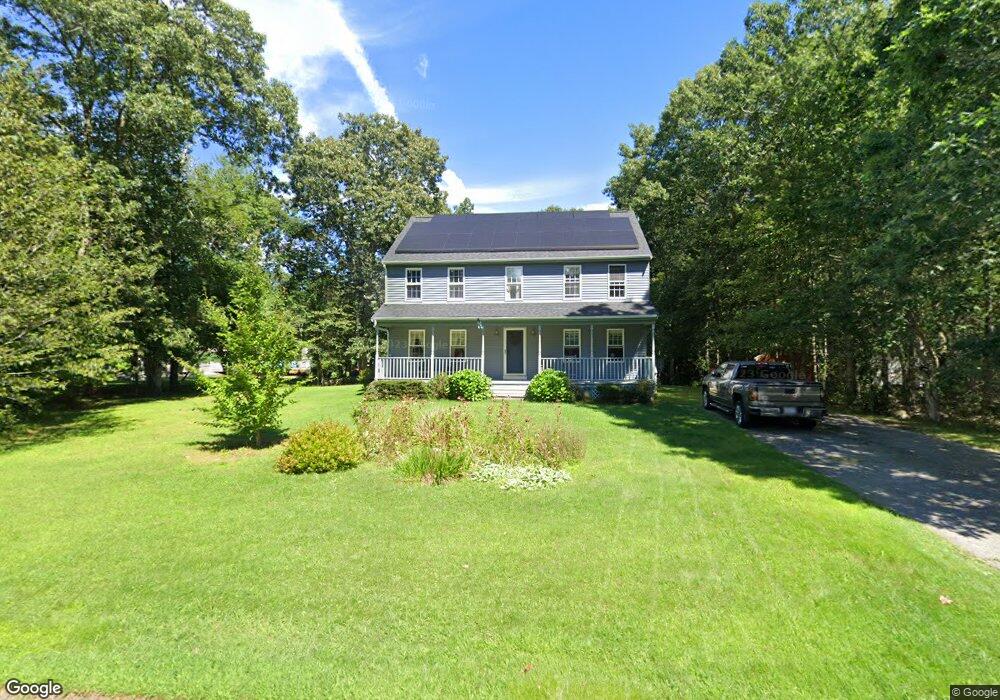
29 Shannon Dr Westport, MA 02790
Brownell/Giffords Corner NeighborhoodEstimated Value: $622,688 - $808,000
3
Beds
--
Bath
1,956
Sq Ft
$368/Sq Ft
Est. Value
About This Home
This home is located at 29 Shannon Dr, Westport, MA 02790 and is currently estimated at $719,672, approximately $367 per square foot. 29 Shannon Dr is a home located in Bristol County with nearby schools including Alice A. Macomber Primary School, Westport Elementary School, and Westport Middle-High School.
Ownership History
Date
Name
Owned For
Owner Type
Purchase Details
Closed on
Dec 13, 2024
Sold by
Cardozo William J and Cardozo Margaret A
Bought by
Cardozo Victoria and Cardozo Ryan
Current Estimated Value
Purchase Details
Closed on
Apr 8, 1996
Sold by
Long Realty Inc
Bought by
Cardozo William J
Home Financials for this Owner
Home Financials are based on the most recent Mortgage that was taken out on this home.
Original Mortgage
$215,200
Interest Rate
7.31%
Mortgage Type
Purchase Money Mortgage
Create a Home Valuation Report for This Property
The Home Valuation Report is an in-depth analysis detailing your home's value as well as a comparison with similar homes in the area
Home Values in the Area
Average Home Value in this Area
Purchase History
| Date | Buyer | Sale Price | Title Company |
|---|---|---|---|
| Cardozo Victoria | -- | None Available | |
| Cardozo William J | -- | None Available | |
| Cardozo Victoria | -- | None Available | |
| Cardozo William J | -- | None Available | |
| Cardozo William J | $49,900 | -- | |
| Cardozo William J | $49,900 | -- |
Source: Public Records
Mortgage History
| Date | Status | Borrower | Loan Amount |
|---|---|---|---|
| Previous Owner | Cardozo William J | $112,251 | |
| Previous Owner | Cardozo William J | $116,000 | |
| Previous Owner | Cardozo William J | $215,200 |
Source: Public Records
Tax History Compared to Growth
Tax History
| Year | Tax Paid | Tax Assessment Tax Assessment Total Assessment is a certain percentage of the fair market value that is determined by local assessors to be the total taxable value of land and additions on the property. | Land | Improvement |
|---|---|---|---|---|
| 2025 | $3,674 | $493,200 | $210,700 | $282,500 |
| 2024 | $3,644 | $471,400 | $195,300 | $276,100 |
| 2023 | $3,532 | $432,800 | $168,100 | $264,700 |
| 2022 | $3,332 | $392,900 | $158,400 | $234,500 |
| 2021 | $3,216 | $373,100 | $144,000 | $229,100 |
| 2020 | $3,097 | $367,400 | $138,300 | $229,100 |
| 2019 | $2,832 | $342,400 | $126,300 | $216,100 |
| 2018 | $2,779 | $340,200 | $125,300 | $214,900 |
| 2017 | $2,708 | $339,800 | $125,300 | $214,500 |
| 2016 | $2,504 | $316,600 | $125,300 | $191,300 |
| 2015 | $2,457 | $309,800 | $125,300 | $184,500 |
Source: Public Records
Map
Nearby Homes
- 118 Charlotte White Rd
- 6 Angel Ct
- 8 Strawberry Ln
- 978 Sodom Rd
- 118 Charlotte White Rd Extension
- 0 Hidden Glen Ln
- Lot 0 Marcotte
- 4 Main Rd
- 218 American Legion Hwy
- 308 Robert St
- 47 Fallon Dr
- 15 Village Way
- 47 Robert St
- 7 Village Way
- 8 Village Way
- 40 Robert St
- 771 Sanford Rd
- 47 Devol Ave
- 33 Moniz Dr
- 837 Main Rd