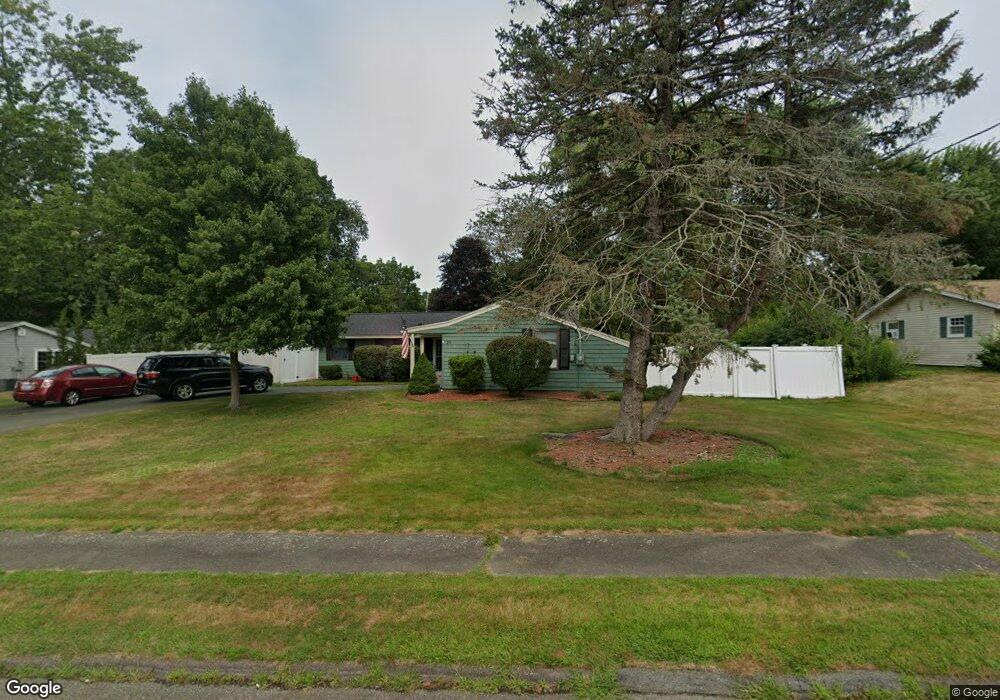
29 Sherwood Ave Danvers, MA 01923
Estimated Value: $711,000 - $718,000
3
Beds
2
Baths
1,175
Sq Ft
$607/Sq Ft
Est. Value
About This Home
This home is located at 29 Sherwood Ave, Danvers, MA 01923 and is currently estimated at $713,493, approximately $607 per square foot. 29 Sherwood Ave is a home located in Essex County with nearby schools including St. Mary of the Annunciation School, North Shore Christian School, and St. John's Prep.
Ownership History
Date
Name
Owned For
Owner Type
Purchase Details
Closed on
Jan 27, 2010
Sold by
Crowley James W and Pursley Caroline B
Bought by
Mcginnity Jill M and Mcginnity Michael R
Current Estimated Value
Home Financials for this Owner
Home Financials are based on the most recent Mortgage that was taken out on this home.
Original Mortgage
$265,475
Outstanding Balance
$174,995
Interest Rate
4.95%
Mortgage Type
Purchase Money Mortgage
Estimated Equity
$538,498
Create a Home Valuation Report for This Property
The Home Valuation Report is an in-depth analysis detailing your home's value as well as a comparison with similar homes in the area
Home Values in the Area
Average Home Value in this Area
Purchase History
| Date | Buyer | Sale Price | Title Company |
|---|---|---|---|
| Mcginnity Jill M | $289,900 | -- |
Source: Public Records
Mortgage History
| Date | Status | Borrower | Loan Amount |
|---|---|---|---|
| Open | Mcginnity Jill M | $265,475 | |
| Previous Owner | Mcginnity Jill M | $352,000 | |
| Previous Owner | Mcginnity Jill M | $276,000 | |
| Previous Owner | Mcginnity Jill M | $51,750 |
Source: Public Records
Tax History Compared to Growth
Tax History
| Year | Tax Paid | Tax Assessment Tax Assessment Total Assessment is a certain percentage of the fair market value that is determined by local assessors to be the total taxable value of land and additions on the property. | Land | Improvement |
|---|---|---|---|---|
| 2025 | $6,572 | $598,000 | $368,700 | $229,300 |
| 2024 | $6,612 | $595,100 | $368,700 | $226,400 |
| 2023 | $6,124 | $521,200 | $335,000 | $186,200 |
| 2022 | $5,995 | $473,500 | $304,000 | $169,500 |
| 2021 | $5,755 | $431,100 | $287,900 | $143,200 |
| 2020 | $5,669 | $434,100 | $284,600 | $149,500 |
| 2019 | $5,421 | $408,200 | $258,700 | $149,500 |
| 2018 | $5,258 | $388,300 | $256,100 | $132,200 |
| 2017 | $5,026 | $354,200 | $223,800 | $130,400 |
| 2016 | $4,793 | $337,500 | $213,400 | $124,100 |
| 2015 | $4,497 | $301,600 | $194,000 | $107,600 |
Source: Public Records
Map
Nearby Homes
- 42 Coolidge Rd
- 4 Brookvale Dr
- 12 Exeter St
- 100 Poplar St
- 35 Locust St Unit 3
- 6 Colby Rd
- 4 Wayside Dr
- 38 High St Unit 4
- 35 High St Unit 3D
- 81 Elliott St
- 25 Cherry St Unit 3
- 8 Putnam St Unit 3
- 5 Beacon St
- 11 Holten St
- 117 Elliott St
- 3 Middlewood Dr Unit 3
- 14 Williams St Unit C17
- 6 Kimberly Dr
- 37 Holten St Unit 2
- 20 Ash St Unit 3