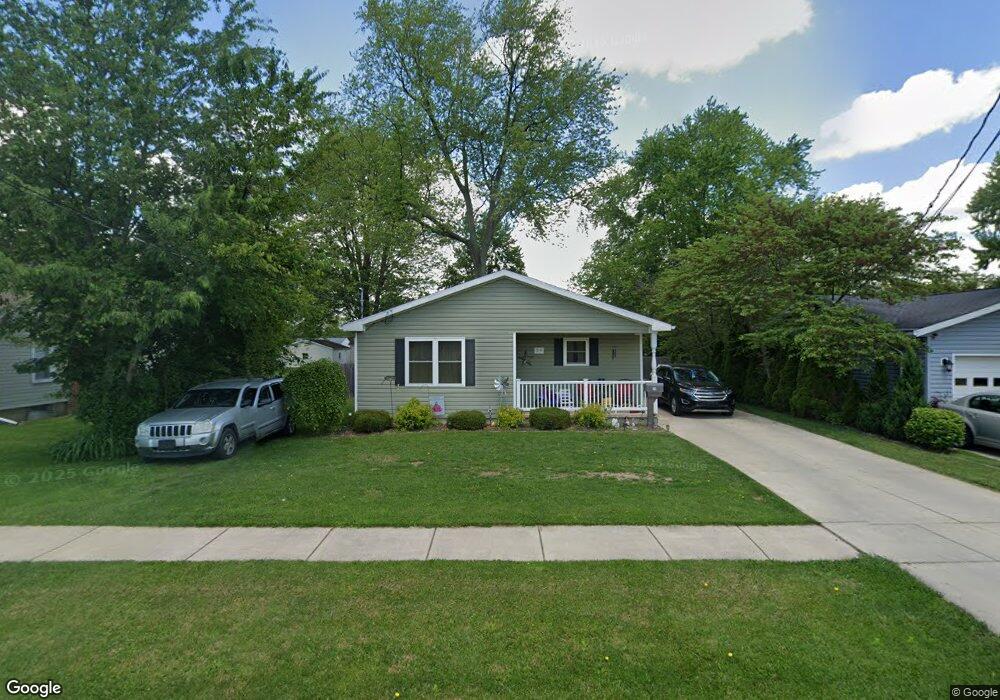
29 Spring St Norwalk, OH 44857
Estimated Value: $146,294 - $173,000
3
Beds
1
Bath
1,504
Sq Ft
$109/Sq Ft
Est. Value
About This Home
This home is located at 29 Spring St, Norwalk, OH 44857 and is currently estimated at $164,574, approximately $109 per square foot. 29 Spring St is a home located in Huron County with nearby schools including Maplehurst Elementary School, League Elementary School, and Pleasant Elementary School.
Ownership History
Date
Name
Owned For
Owner Type
Purchase Details
Closed on
Sep 7, 2017
Sold by
Firelands Habitat For Humanity Inc
Bought by
Maynard Richard and Maynard Stacey
Current Estimated Value
Home Financials for this Owner
Home Financials are based on the most recent Mortgage that was taken out on this home.
Original Mortgage
$95,000
Outstanding Balance
$78,032
Interest Rate
3.92%
Mortgage Type
Seller Take Back
Estimated Equity
$86,542
Purchase Details
Closed on
May 27, 2016
Sold by
Us Bank National Association
Bought by
Firelands Habitat For Humanity
Purchase Details
Closed on
Apr 4, 2016
Sold by
Shupe Tamara L
Bought by
U S Bank National Association
Purchase Details
Closed on
Nov 15, 2000
Sold by
Wyatt Theresa R
Bought by
Shupe Tamara L
Purchase Details
Closed on
Nov 23, 1979
Bought by
Wyatt Theresa Rose
Create a Home Valuation Report for This Property
The Home Valuation Report is an in-depth analysis detailing your home's value as well as a comparison with similar homes in the area
Home Values in the Area
Average Home Value in this Area
Purchase History
We collect this data history from publicly available records. To have your information removed, we recommend requesting removal directly through your county’s website.
| Date | Buyer | Sale Price | Title Company |
|---|---|---|---|
| Maynard Richard | $95,000 | Attorney | |
| Firelands Habitat For Humanity | -- | Attorney | |
| U S Bank National Association | $16,000 | Attorney | |
| Shupe Tamara L | $55,000 | -- | |
| Wyatt Theresa Rose | $31,000 | -- |
Source: Public Records
Mortgage History
We collect this data history from publicly available records. To have your information removed, we recommend requesting removal directly through your county’s website.
| Date | Status | Borrower | Loan Amount |
|---|---|---|---|
| Open | Maynard Richard | $95,000 |
Source: Public Records
Tax History
| Year | Tax Paid | Tax Assessment Tax Assessment Total Assessment is a certain percentage of the fair market value that is determined by local assessors to be the total taxable value of land and additions on the property. | Land | Improvement |
|---|---|---|---|---|
| 2025 | $1,594 | $49,080 | $6,050 | $43,030 |
| 2024 | -- | $49,080 | $6,050 | $43,030 |
| 2023 | $2,003 | $38,850 | $5,310 | $33,540 |
| 2022 | $1,566 | $38,850 | $5,310 | $33,540 |
| 2021 | $1,678 | $41,620 | $5,310 | $36,310 |
| 2020 | $1,431 | $33,750 | $5,310 | $28,440 |
| 2019 | $1,399 | $33,750 | $5,310 | $28,440 |
| 2018 | $1,375 | $33,750 | $5,310 | $28,440 |
| 2017 | $222 | $5,310 | $5,310 | $0 |
| 2016 | $753 | $18,320 | $5,310 | $13,010 |
| 2015 | $734 | $18,330 | $5,320 | $13,010 |
| 2014 | $760 | $18,800 | $5,740 | $13,060 |
| 2013 | $660 | $18,800 | $5,740 | $13,060 |
Source: Public Records
Map
Nearby Homes
- 167 Whittlesey Ave
- 116 Milan Ave
- 131 Whittlesey Ave
- 230 Whittlesey Ave Unit 6
- 230 Whittlesey Ave Unit 5
- 73 Milan Ave
- 12 White Tail Way Unit C
- 65 Wooster St
- 40 Reed St
- 17 Chatham St
- 9 Chatham St
- 0 Milan Ave
- 408 Milan Ave
- 123 E Main St
- 47 Grove Ave
- 15 Minard Place
- 60 Grassland Cir
- 52 N Pleasant St
- 53 N Pleasant St
- 184 Tucker Ave
Your Personal Tour Guide
Ask me questions while you tour the home.