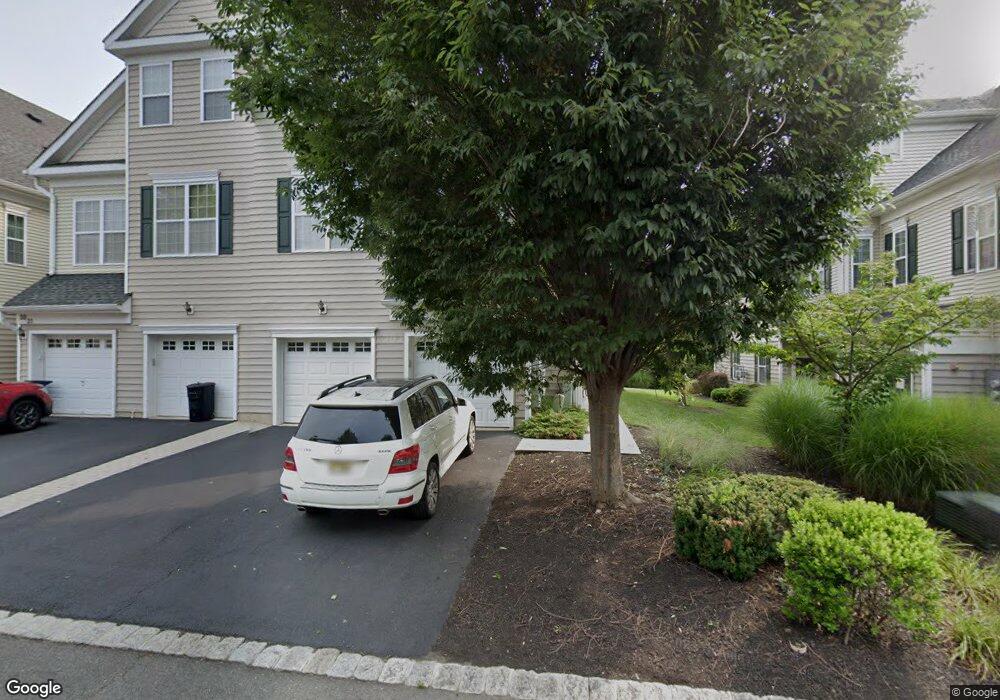
29 Swing Bridge Ln South Bound Brook, NJ 08880
Estimated Value: $442,000 - $473,000
Studio
--
Bath
1,640
Sq Ft
$276/Sq Ft
Est. Value
About This Home
This home is located at 29 Swing Bridge Ln, South Bound Brook, NJ 08880 and is currently estimated at $452,463, approximately $275 per square foot. 29 Swing Bridge Ln is a home located in Somerset County with nearby schools including Robert Morris School and Green Brook Academy.
Ownership History
Date
Name
Owned For
Owner Type
Purchase Details
Closed on
Jul 27, 2006
Sold by
Matzel & Mumford At South Boun
Bought by
Russinoff Marc E and Russinoff Keith A
Current Estimated Value
Home Financials for this Owner
Home Financials are based on the most recent Mortgage that was taken out on this home.
Original Mortgage
$300,000
Interest Rate
6.47%
Create a Home Valuation Report for This Property
The Home Valuation Report is an in-depth analysis detailing your home's value as well as a comparison with similar homes in the area
Home Values in the Area
Average Home Value in this Area
Purchase History
| Date | Buyer | Sale Price | Title Company |
|---|---|---|---|
| Russinoff Marc E | $380,025 | -- |
Source: Public Records
Mortgage History
| Date | Status | Borrower | Loan Amount |
|---|---|---|---|
| Previous Owner | Russinoff Marc E | $300,000 |
Source: Public Records
Tax History
| Year | Tax Paid | Tax Assessment Tax Assessment Total Assessment is a certain percentage of the fair market value that is determined by local assessors to be the total taxable value of land and additions on the property. | Land | Improvement |
|---|---|---|---|---|
| 2025 | -- | $275,000 | $60,000 | $215,000 |
| 2024 | -- | $275,000 | $60,000 | $215,000 |
| 2023 | -- | $275,000 | $60,000 | $215,000 |
| 2022 | -- | $275,000 | $60,000 | $215,000 |
| 2021 | $0 | $275,000 | $60,000 | $215,000 |
| 2020 | $0 | $350,800 | $60,000 | $290,800 |
| 2019 | $0 | $350,800 | $60,000 | $290,800 |
| 2018 | $0 | $350,800 | $60,000 | $290,800 |
| 2017 | $0 | $350,800 | $60,000 | $290,800 |
| 2016 | $0 | $350,800 | $60,000 | $290,800 |
| 2015 | -- | $350,800 | $60,000 | $290,800 |
| 2014 | -- | $350,800 | $60,000 | $290,800 |
Source: Public Records
Map
Nearby Homes
- 8 Swing Bridge Ln Unit 904
- 105 Swing Bridge Ln Unit 1009
- 123 Edgewood Terrace
- 112 East St
- 120B Little Place
- 216 Chestnut St
- 20 van Syckle Blvd
- 315 East St
- 311 Chestnut St
- 29-31 John St
- 17 Talmage Ave
- 408 E Union Ave
- 26 Louis Ave
- 328 John St
- 306 Church St
- 531 Chestnut St
- 535 Madison Ave
- 303 Ashland Rd
- 151 Beechwood Ave
- 126 W High St
- 33 Swing Bridge Ln
- 27 Swing Bridge Ln
- 31 Swing Bridge Ln
- 25 Swing Bridge Ln Unit 111
- 37 Swing Bridge Ln
- 23 Swing Bridge Ln
- 41 Swing Bridge Ln
- 39 Swing Bridge Ln
- 19 Swing Bridge Ln Unit 114
- 17 Swing Bridge Ln Unit 115
- 45 Swing Bridge Ln Unit Condo
- 45 Swing Bridge Ln
- 43 Swing Bridge Ln
- 1 Tory Jack Terrace Unit 312
- 15 Swing Bridge Ln Unit 116
- 3 Tory Jack Terrace
- 11 Swing Bridge Ln Unit 117
- 47 Swing Bridge Ln
- 49 Swing Bridge Ln Unit 1301
- 5 Tory Jack Terrace
Your Personal Tour Guide
Ask me questions while you tour the home.