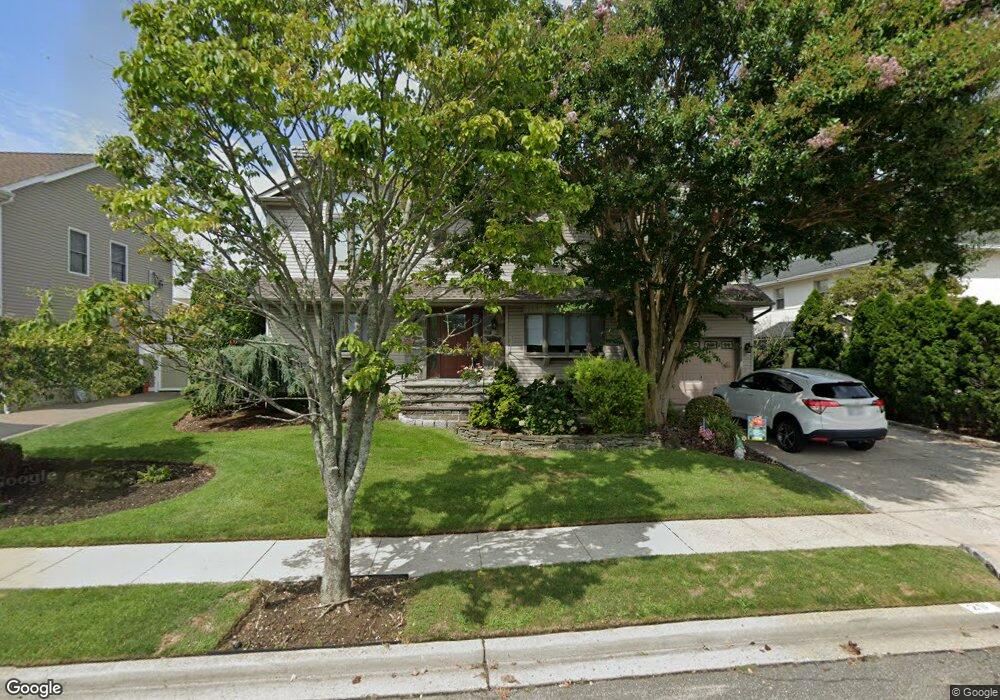
29 Sylvia Rd Plainview, NY 11803
Estimated Value: $791,206 - $1,103,000
Studio
3
Baths
2,315
Sq Ft
$409/Sq Ft
Est. Value
About This Home
This home is located at 29 Sylvia Rd, Plainview, NY 11803 and is currently estimated at $947,103, approximately $409 per square foot. 29 Sylvia Rd is a home located in Nassau County with nearby schools including Charles Campagne Elementary School, John F Kennedy Middle School, and Bethpage Senior High School.
Ownership History
Date
Name
Owned For
Owner Type
Purchase Details
Closed on
Apr 21, 2025
Sold by
Guida Anthony and Guida Debra
Bought by
Guida Anthony C and Guida Debra L
Current Estimated Value
Purchase Details
Closed on
Dec 13, 2000
Sold by
Antonioli Mark
Bought by
Guida Anthony
Purchase Details
Closed on
Nov 10, 1999
Sold by
Priolo Philip
Bought by
Antonioli Mark
Home Financials for this Owner
Home Financials are based on the most recent Mortgage that was taken out on this home.
Original Mortgage
$290,000
Interest Rate
6.12%
Mortgage Type
Purchase Money Mortgage
Purchase Details
Closed on
Mar 2, 1999
Sold by
Dowdell James D
Bought by
Priolo Philip
Purchase Details
Closed on
Nov 20, 1998
Sold by
Rosen Joshua and Rosen Guita
Bought by
Dowdell James E
Create a Home Valuation Report for This Property
The Home Valuation Report is an in-depth analysis detailing your home's value as well as a comparison with similar homes in the area
Home Values in the Area
Average Home Value in this Area
Purchase History
| Date | Buyer | Sale Price | Title Company |
|---|---|---|---|
| Guida Anthony C | -- | None Available | |
| Guida Anthony | $490,000 | Harris Grossman | |
| Guida Anthony | $490,000 | Harris Grossman | |
| Antonioli Mark | $390,000 | -- | |
| Antonioli Mark | $390,000 | -- | |
| Antonioli Mark | $390,000 | -- | |
| Antonioli Mark | $390,000 | -- | |
| Priolo Philip | $205,000 | -- | |
| Priolo Philip | $205,000 | -- | |
| Dowdell James E | $155,000 | -- | |
| Dowdell James E | $155,000 | -- |
Source: Public Records
Mortgage History
| Date | Status | Borrower | Loan Amount |
|---|---|---|---|
| Previous Owner | Antonioli Mark | $290,000 |
Source: Public Records
Tax History
| Year | Tax Paid | Tax Assessment Tax Assessment Total Assessment is a certain percentage of the fair market value that is determined by local assessors to be the total taxable value of land and additions on the property. | Land | Improvement |
|---|---|---|---|---|
| 2025 | $16,091 | $608 | $254 | $354 |
| 2024 | $5,745 | $629 | $263 | $366 |
Source: Public Records
Map
Nearby Homes
Your Personal Tour Guide
Ask me questions while you tour the home.