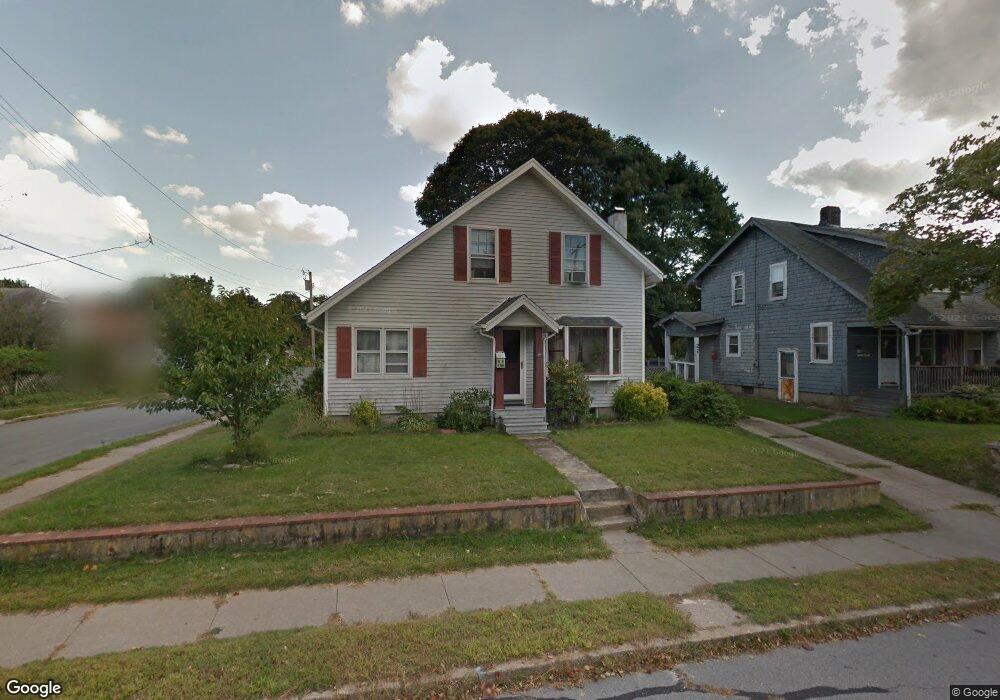
29 Taber St Fairhaven, MA 02719
Oxford NeighborhoodEstimated Value: $409,938 - $450,000
3
Beds
1
Bath
945
Sq Ft
$460/Sq Ft
Est. Value
About This Home
This home is located at 29 Taber St, Fairhaven, MA 02719 and is currently estimated at $434,985, approximately $460 per square foot. 29 Taber St is a home located in Bristol County with nearby schools including Fairhaven High School, Alma Del Mar Charter School, and City On A Hill Charter Public School New Bedford.
Ownership History
Date
Name
Owned For
Owner Type
Purchase Details
Closed on
Oct 22, 2014
Sold by
Davis Gregory S
Bought by
Walker Nathaniel S
Current Estimated Value
Home Financials for this Owner
Home Financials are based on the most recent Mortgage that was taken out on this home.
Original Mortgage
$224,572
Outstanding Balance
$173,112
Interest Rate
4.25%
Mortgage Type
FHA
Estimated Equity
$261,873
Purchase Details
Closed on
Jan 15, 2008
Sold by
Sylvia Anneke W and Sylvia Anneke
Bought by
Davis Gregory S and Walker Nathaniel S
Home Financials for this Owner
Home Financials are based on the most recent Mortgage that was taken out on this home.
Original Mortgage
$250,075
Interest Rate
6.21%
Mortgage Type
Purchase Money Mortgage
Create a Home Valuation Report for This Property
The Home Valuation Report is an in-depth analysis detailing your home's value as well as a comparison with similar homes in the area
Home Values in the Area
Average Home Value in this Area
Purchase History
| Date | Buyer | Sale Price | Title Company |
|---|---|---|---|
| Walker Nathaniel S | -- | -- | |
| Davis Gregory S | $254,000 | -- |
Source: Public Records
Mortgage History
| Date | Status | Borrower | Loan Amount |
|---|---|---|---|
| Open | Walker Nathaniel S | $224,572 | |
| Previous Owner | Davis Gregory S | $251,209 | |
| Previous Owner | Davis Gregory S | $250,075 | |
| Previous Owner | Davis Gregory S | $60,000 |
Source: Public Records
Tax History
| Year | Tax Paid | Tax Assessment Tax Assessment Total Assessment is a certain percentage of the fair market value that is determined by local assessors to be the total taxable value of land and additions on the property. | Land | Improvement |
|---|---|---|---|---|
| 2025 | $31 | $328,900 | $168,800 | $160,100 |
| 2024 | $3,176 | $344,100 | $168,800 | $175,300 |
| 2023 | $3,099 | $311,500 | $147,900 | $163,600 |
| 2022 | $3,010 | $294,500 | $137,400 | $157,100 |
| 2021 | $2,898 | $256,700 | $124,300 | $132,400 |
| 2020 | $2,839 | $256,700 | $124,300 | $132,400 |
| 2019 | $2,629 | $225,300 | $103,100 | $122,200 |
| 2018 | $2,441 | $213,500 | $98,200 | $115,300 |
| 2017 | $2,459 | $204,200 | $98,200 | $106,000 |
| 2016 | $2,378 | $195,200 | $98,200 | $97,000 |
| 2015 | $2,346 | $193,100 | $98,200 | $94,900 |
Source: Public Records
Map
Nearby Homes
- 442 Dana Farms
- 14 Sycamore St
- 313 Main St
- 24 Academy Ave
- 253 Adams St
- 10 Livesey Pkwy
- 138 Main St Unit 13
- 71 Sycamore St
- 15 School St
- 16 Ash St
- 34 Washburn St Unit 36
- 24 Cotter St
- 67 Bridge St
- 39 Christian St
- 239 Sawyer St
- 77 Adams St
- 1301 Pleasant St Unit 1305
- 8 Washington St
- 1441 Pleasant St
- 272 Sawyer St
Your Personal Tour Guide
Ask me questions while you tour the home.