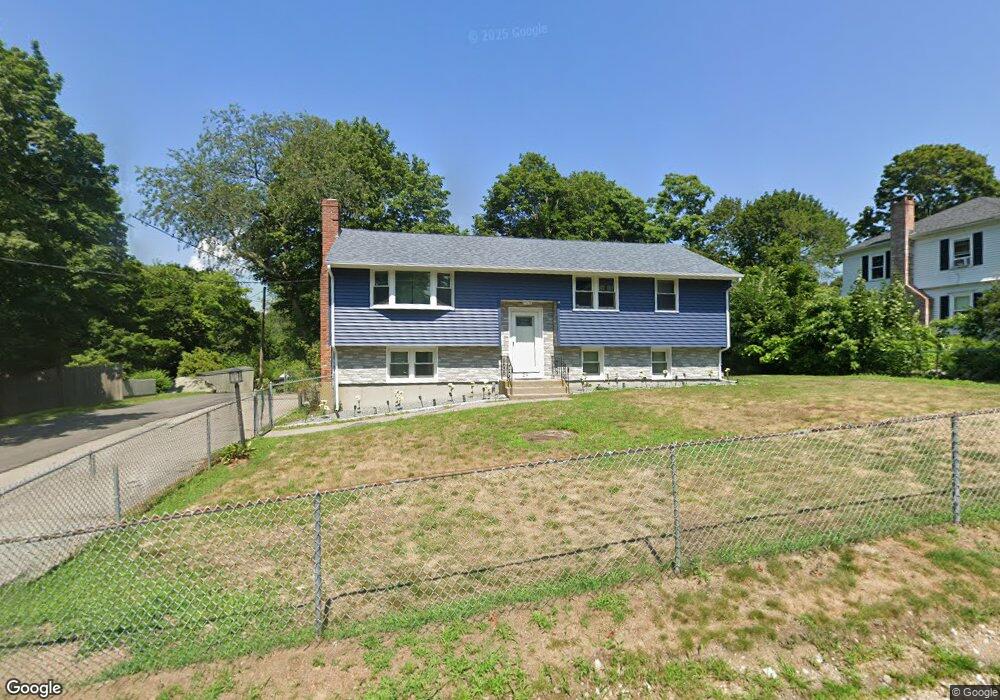
29 Talbot St Stoughton, MA 02072
Estimated Value: $626,000 - $667,000
3
Beds
2
Baths
2,334
Sq Ft
$277/Sq Ft
Est. Value
About This Home
This home is located at 29 Talbot St, Stoughton, MA 02072 and is currently estimated at $647,229, approximately $277 per square foot. 29 Talbot St is a home located in Norfolk County with nearby schools including Joseph R Dawe Jr Elementary School, Dr. Robert G. O'Donnell Middle School, and Stoughton High School.
Ownership History
Date
Name
Owned For
Owner Type
Purchase Details
Closed on
Apr 14, 2022
Sold by
Gondi-Kalluru Ft and Gondi
Bought by
Mahan Ivone
Current Estimated Value
Home Financials for this Owner
Home Financials are based on the most recent Mortgage that was taken out on this home.
Original Mortgage
$350,000
Outstanding Balance
$325,818
Interest Rate
3.76%
Mortgage Type
Purchase Money Mortgage
Estimated Equity
$321,411
Purchase Details
Closed on
Mar 21, 2017
Sold by
Kalluru Sireesha
Bought by
Gondi Kalluru Ft and Gondi
Purchase Details
Closed on
Apr 15, 2009
Sold by
Legros Jean R and Legros Norma
Bought by
Kallura Sireesha and Kalluru Sireesha
Home Financials for this Owner
Home Financials are based on the most recent Mortgage that was taken out on this home.
Original Mortgage
$294,556
Interest Rate
5.02%
Mortgage Type
Purchase Money Mortgage
Purchase Details
Closed on
Nov 27, 1992
Sold by
Hocheiser Steven D and Hocheiser Peggy D
Bought by
Legros Norma and Legros Jean R
Create a Home Valuation Report for This Property
The Home Valuation Report is an in-depth analysis detailing your home's value as well as a comparison with similar homes in the area
Home Values in the Area
Average Home Value in this Area
Purchase History
| Date | Buyer | Sale Price | Title Company |
|---|---|---|---|
| Mahan Ivone | $490,000 | None Available | |
| Mahan Ivone | $490,000 | None Available | |
| Mahan Ivone | $490,000 | None Available | |
| Gondi Kalluru Ft | -- | -- | |
| Gondi Kalluru Ft | -- | -- | |
| Gondi Kalluru Ft | -- | -- | |
| Kallura Sireesha | $299,999 | -- | |
| Kallura Sireesha | $299,999 | -- | |
| Kallura Sireesha | $299,999 | -- | |
| Legros Norma | $130,000 | -- | |
| Legros Norma | $130,000 | -- |
Source: Public Records
Mortgage History
| Date | Status | Borrower | Loan Amount |
|---|---|---|---|
| Open | Mahan Ivone | $350,000 | |
| Closed | Mahan Ivone | $350,000 | |
| Previous Owner | Legros Norma | $290,375 | |
| Previous Owner | Kallura Sireesha | $294,556 |
Source: Public Records
Tax History Compared to Growth
Tax History
| Year | Tax Paid | Tax Assessment Tax Assessment Total Assessment is a certain percentage of the fair market value that is determined by local assessors to be the total taxable value of land and additions on the property. | Land | Improvement |
|---|---|---|---|---|
| 2025 | $7,201 | $581,700 | $209,300 | $372,400 |
| 2024 | $6,987 | $548,900 | $190,700 | $358,200 |
| 2023 | $6,752 | $498,300 | $177,200 | $321,100 |
| 2022 | $6,725 | $466,700 | $162,000 | $304,700 |
| 2021 | $6,304 | $417,500 | $146,800 | $270,700 |
| 2020 | $5,992 | $402,400 | $141,800 | $260,600 |
| 2019 | $6,027 | $392,900 | $141,800 | $251,100 |
| 2018 | $5,330 | $359,900 | $135,000 | $224,900 |
| 2017 | $5,029 | $347,100 | $128,300 | $218,800 |
| 2016 | $4,891 | $326,700 | $118,100 | $208,600 |
| 2015 | $4,842 | $320,000 | $111,400 | $208,600 |
| 2014 | $4,629 | $294,100 | $101,300 | $192,800 |
Source: Public Records
Map
Nearby Homes
- 29 Talbot St Unit 1
- 21 Talbot St
- 19 Talbot St
- 19 Talbot St
- 24 Talbot St
- 36 Talbot St
- 45 Lambert Ave
- 16 Talbot St
- 758 Central St
- 766 Central St
- 27 Lambert Ave
- 748 Central St
- 776 Central St
- 57 Lambert Ave
- 57 Lambert Ave Unit 1
- 740 Central St
- 402 Pleasant St
- 402 Pleasant St Unit 402
- 392 Pleasant St
- 732 Central St