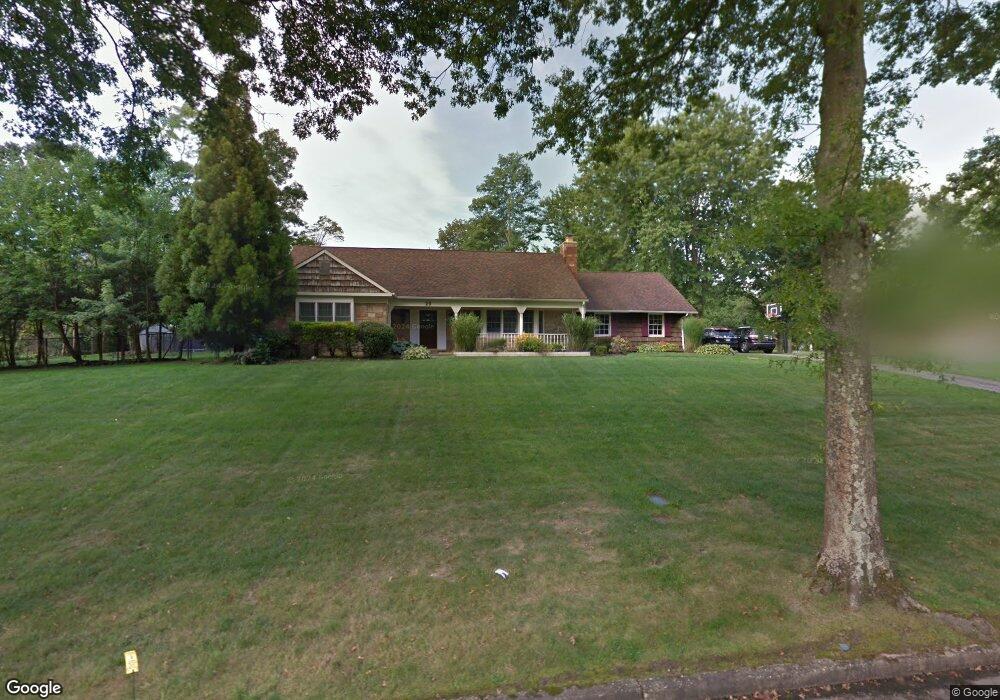
29 Thorngrove Ln Dix Hills, NY 11746
Estimated Value: $1,317,480 - $1,495,000
--
Bed
--
Bath
--
Sq Ft
0.75
Acres
About This Home
This home is located at 29 Thorngrove Ln, Dix Hills, NY 11746 and is currently estimated at $1,399,120. 29 Thorngrove Ln is a home located in Suffolk County with nearby schools including Paumanok Elementary School, West Hollow Middle School, and Half Hollow Hills High School East.
Ownership History
Date
Name
Owned For
Owner Type
Purchase Details
Closed on
Jul 19, 2010
Sold by
Leffler Robert and Leffler Deborah
Bought by
Funk Matthew and Funk Amy
Current Estimated Value
Home Financials for this Owner
Home Financials are based on the most recent Mortgage that was taken out on this home.
Original Mortgage
$676,000
Outstanding Balance
$450,556
Interest Rate
4.78%
Mortgage Type
Purchase Money Mortgage
Estimated Equity
$948,564
Purchase Details
Closed on
Dec 13, 1999
Sold by
Farrell Kevin R
Bought by
Leffler Robert and Leffler Deborah
Home Financials for this Owner
Home Financials are based on the most recent Mortgage that was taken out on this home.
Original Mortgage
$385,600
Interest Rate
7.12%
Purchase Details
Closed on
Oct 21, 1996
Sold by
Farrell Susan and Farrell Kevin R
Bought by
Farrell Kevin R
Create a Home Valuation Report for This Property
The Home Valuation Report is an in-depth analysis detailing your home's value as well as a comparison with similar homes in the area
Home Values in the Area
Average Home Value in this Area
Purchase History
| Date | Buyer | Sale Price | Title Company |
|---|---|---|---|
| Funk Matthew | $845,000 | -- | |
| Leffler Robert | $482,000 | Lawyers Title Insurance Corp | |
| Farrell Kevin R | -- | -- |
Source: Public Records
Mortgage History
| Date | Status | Borrower | Loan Amount |
|---|---|---|---|
| Open | Funk Matthew | $676,000 | |
| Closed | Funk Matthew | $42,250 | |
| Previous Owner | Leffler Robert | $385,600 |
Source: Public Records
Tax History Compared to Growth
Tax History
| Year | Tax Paid | Tax Assessment Tax Assessment Total Assessment is a certain percentage of the fair market value that is determined by local assessors to be the total taxable value of land and additions on the property. | Land | Improvement |
|---|---|---|---|---|
| 2024 | $22,195 | $5,630 | $875 | $4,755 |
| 2023 | $11,097 | $5,630 | $875 | $4,755 |
| 2022 | $21,387 | $5,630 | $875 | $4,755 |
| 2021 | $20,912 | $5,630 | $875 | $4,755 |
| 2020 | $20,653 | $5,630 | $875 | $4,755 |
| 2019 | $41,307 | $0 | $0 | $0 |
| 2018 | $18,564 | $5,630 | $875 | $4,755 |
| 2017 | $18,564 | $5,630 | $875 | $4,755 |
| 2016 | $18,123 | $5,630 | $875 | $4,755 |
| 2015 | -- | $5,630 | $875 | $4,755 |
| 2014 | -- | $5,630 | $875 | $4,755 |
Source: Public Records
Map
Nearby Homes
- 118 Ryder Ave
- 78 Bagatelle Rd
- 11 Sienna Ct
- 22 Sienna Ct
- 24 Sienna Ct
- 200 Bagatelle Rd
- 11 Gorham Ln
- 34 Calumet Dr
- 25 Farmington Ln
- 14 S Hollow Rd
- 32 Rustic Gate Ln
- 10 Threepence Dr
- 4 Coventry Ct
- 65 Landscape Dr
- 26 Sleepy Hollow Ln
- 6 Merle Place
- 31 Perry Ln
- 32 Seaman Neck Rd
- 3 Jacobs Path
- 22 Landscape Dr