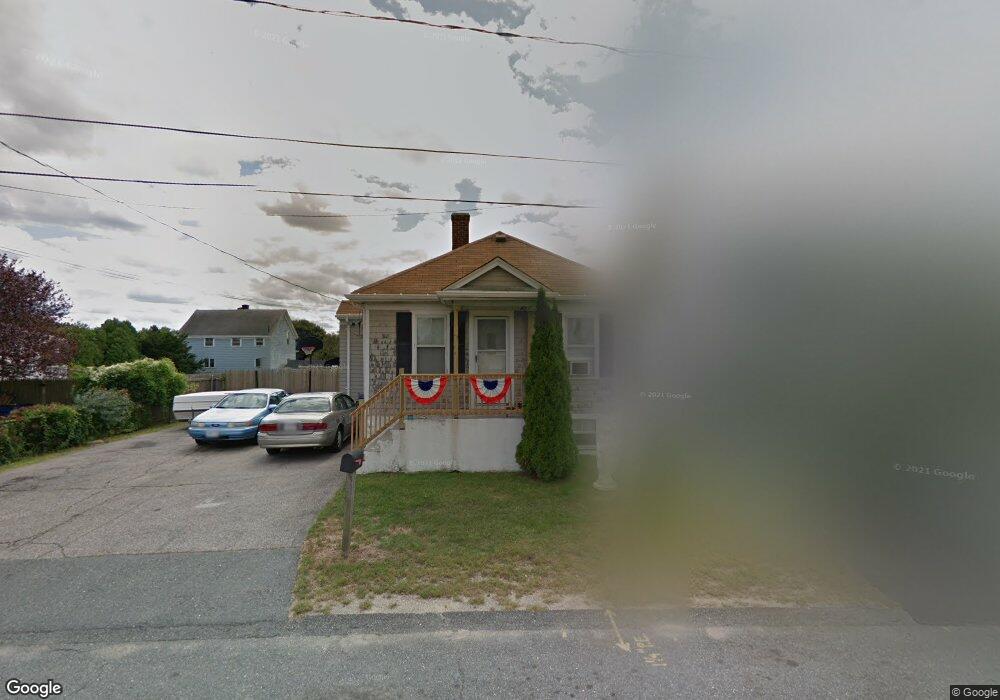
29 Tucker St Fall River, MA 02724
Father Kelly NeighborhoodEstimated Value: $374,561 - $450,000
2
Beds
1
Bath
1,488
Sq Ft
$273/Sq Ft
Est. Value
About This Home
This home is located at 29 Tucker St, Fall River, MA 02724 and is currently estimated at $405,890, approximately $272 per square foot. 29 Tucker St is a home located in Bristol County with nearby schools including Henry Lord Community School, B M C Durfee High School, and Argosy Collegiate Charter School.
Ownership History
Date
Name
Owned For
Owner Type
Purchase Details
Closed on
Mar 21, 2003
Sold by
Paquet Madelyn P and Paquet Raymond E
Bought by
Paquet Kyle C and Paquet Madelyn P
Current Estimated Value
Home Financials for this Owner
Home Financials are based on the most recent Mortgage that was taken out on this home.
Original Mortgage
$100,000
Interest Rate
5.9%
Mortgage Type
Purchase Money Mortgage
Purchase Details
Closed on
Jul 7, 1999
Sold by
Viera Mario J
Bought by
Gmac Mtg Corp
Purchase Details
Closed on
May 9, 1997
Sold by
Almeida Jose and Almeida Anabela
Bought by
Viera Mario J and Vieira Maria
Purchase Details
Closed on
Jun 19, 1995
Sold by
Dazzeo Sandra
Bought by
Martin Thomas W and Flynn Kevin A
Purchase Details
Closed on
Mar 15, 1995
Sold by
Costello Richard and Arruda David J
Bought by
Almeida Jose and Almeida Anabela
Create a Home Valuation Report for This Property
The Home Valuation Report is an in-depth analysis detailing your home's value as well as a comparison with similar homes in the area
Home Values in the Area
Average Home Value in this Area
Purchase History
| Date | Buyer | Sale Price | Title Company |
|---|---|---|---|
| Paquet Kyle C | -- | -- | |
| Gmac Mtg Corp | $102,189 | -- | |
| Viera Mario J | $102,400 | -- | |
| Martin Thomas W | $49,000 | -- | |
| Almeida Jose | $61,000 | -- |
Source: Public Records
Mortgage History
| Date | Status | Borrower | Loan Amount |
|---|---|---|---|
| Open | Almeida Jose | $30,000 | |
| Open | Almeida Jose | $120,000 | |
| Closed | Almeida Jose | $100,000 |
Source: Public Records
Tax History
| Year | Tax Paid | Tax Assessment Tax Assessment Total Assessment is a certain percentage of the fair market value that is determined by local assessors to be the total taxable value of land and additions on the property. | Land | Improvement |
|---|---|---|---|---|
| 2025 | $3,497 | $305,400 | $127,200 | $178,200 |
| 2024 | $3,276 | $285,100 | $122,300 | $162,800 |
| 2023 | $3,099 | $252,600 | $104,900 | $147,700 |
| 2022 | $2,698 | $213,800 | $95,300 | $118,500 |
| 2021 | $2,564 | $185,400 | $88,200 | $97,200 |
| 2020 | $2,472 | $171,100 | $84,400 | $86,700 |
| 2019 | $2,344 | $160,800 | $80,400 | $80,400 |
| 2018 | $2,289 | $156,600 | $78,900 | $77,700 |
| 2017 | $2,194 | $156,700 | $80,500 | $76,200 |
| 2016 | $2,125 | $155,900 | $83,900 | $72,000 |
| 2015 | $1,999 | $152,800 | $80,800 | $72,000 |
| 2014 | $1,975 | $157,000 | $85,000 | $72,000 |
Source: Public Records
Map
Nearby Homes
Your Personal Tour Guide
Ask me questions while you tour the home.