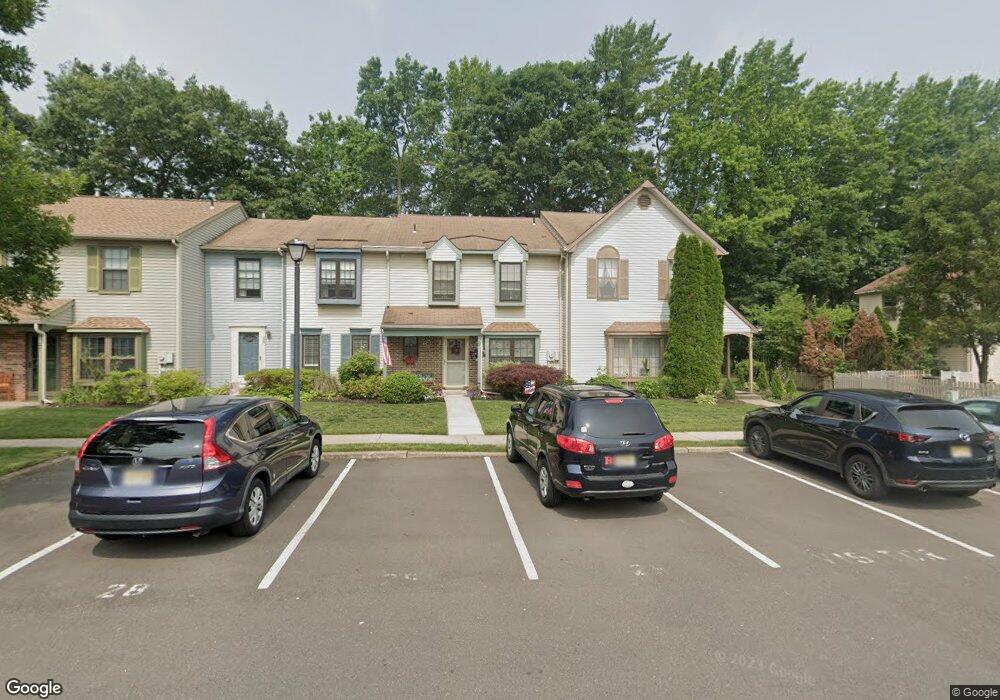
29 Tynemouth Ct Trenton, NJ 08691
Estimated Value: $358,964 - $449,000
--
Bed
--
Bath
1,408
Sq Ft
$288/Sq Ft
Est. Value
About This Home
This home is located at 29 Tynemouth Ct, Trenton, NJ 08691 and is currently estimated at $405,991, approximately $288 per square foot. 29 Tynemouth Ct is a home located in Mercer County with nearby schools including Sharon Elementary School, Pond Road Middle School, and Robbinsville High School.
Ownership History
Date
Name
Owned For
Owner Type
Purchase Details
Closed on
Nov 26, 2012
Sold by
Dore Eileen and Moran Eileen
Bought by
Moran Eileen
Current Estimated Value
Home Financials for this Owner
Home Financials are based on the most recent Mortgage that was taken out on this home.
Original Mortgage
$150,000
Outstanding Balance
$104,072
Interest Rate
3.4%
Mortgage Type
New Conventional
Estimated Equity
$301,919
Purchase Details
Closed on
Sep 11, 2007
Sold by
Moran Eileen and Dore Robert
Bought by
Dore Eileen and Dore Robert
Purchase Details
Closed on
Jan 25, 1994
Sold by
Draft Mark
Bought by
Moran Eileen
Home Financials for this Owner
Home Financials are based on the most recent Mortgage that was taken out on this home.
Original Mortgage
$98,000
Interest Rate
7.12%
Mortgage Type
Purchase Money Mortgage
Create a Home Valuation Report for This Property
The Home Valuation Report is an in-depth analysis detailing your home's value as well as a comparison with similar homes in the area
Home Values in the Area
Average Home Value in this Area
Purchase History
| Date | Buyer | Sale Price | Title Company |
|---|---|---|---|
| Moran Eileen | -- | None Available | |
| Dore Eileen | -- | -- | |
| Moran Eileen | $104,000 | -- |
Source: Public Records
Mortgage History
| Date | Status | Borrower | Loan Amount |
|---|---|---|---|
| Open | Moran Eileen | $150,000 | |
| Previous Owner | Moran Eileen | $98,000 |
Source: Public Records
Tax History Compared to Growth
Tax History
| Year | Tax Paid | Tax Assessment Tax Assessment Total Assessment is a certain percentage of the fair market value that is determined by local assessors to be the total taxable value of land and additions on the property. | Land | Improvement |
|---|---|---|---|---|
| 2025 | $6,517 | $195,000 | $143,000 | $52,000 |
| 2024 | $6,082 | $195,000 | $143,000 | $52,000 |
| 2023 | $6,082 | $195,000 | $143,000 | $52,000 |
| 2022 | $5,846 | $195,000 | $143,000 | $52,000 |
| 2021 | $5,762 | $195,000 | $143,000 | $52,000 |
| 2020 | $5,764 | $195,000 | $143,000 | $52,000 |
| 2019 | $5,766 | $195,000 | $143,000 | $52,000 |
| 2018 | $5,729 | $195,000 | $143,000 | $52,000 |
| 2017 | $5,717 | $195,000 | $143,000 | $52,000 |
| 2016 | $5,665 | $195,000 | $143,000 | $52,000 |
| 2015 | $5,579 | $195,000 | $143,000 | $52,000 |
| 2014 | $5,598 | $195,000 | $143,000 | $52,000 |
Source: Public Records
Map
Nearby Homes
- 28 Tynemouth Ct
- 30 Tynemouth Ct
- 27 Tynemouth Ct
- 26 Tynemouth Ct
- 25 Tynemouth Ct
- 31 Tynemouth Ct
- 32 Tynemouth Ct
- 33 Tynemouth Ct
- 34 Tynemouth Ct
- 35 Tynemouth Ct
- 36 Tynemouth Ct
- 21 Tynemouth Ct
- 22 Tynemouth Ct
- 23 Tynemouth Ct
- 20 Tynemouth Ct
- 37 Tynemouth Ct
- 49 Tynemouth Ct
- 50 Tynemouth Ct
- 51 Tynemouth Ct
- 52 Tynemouth Ct