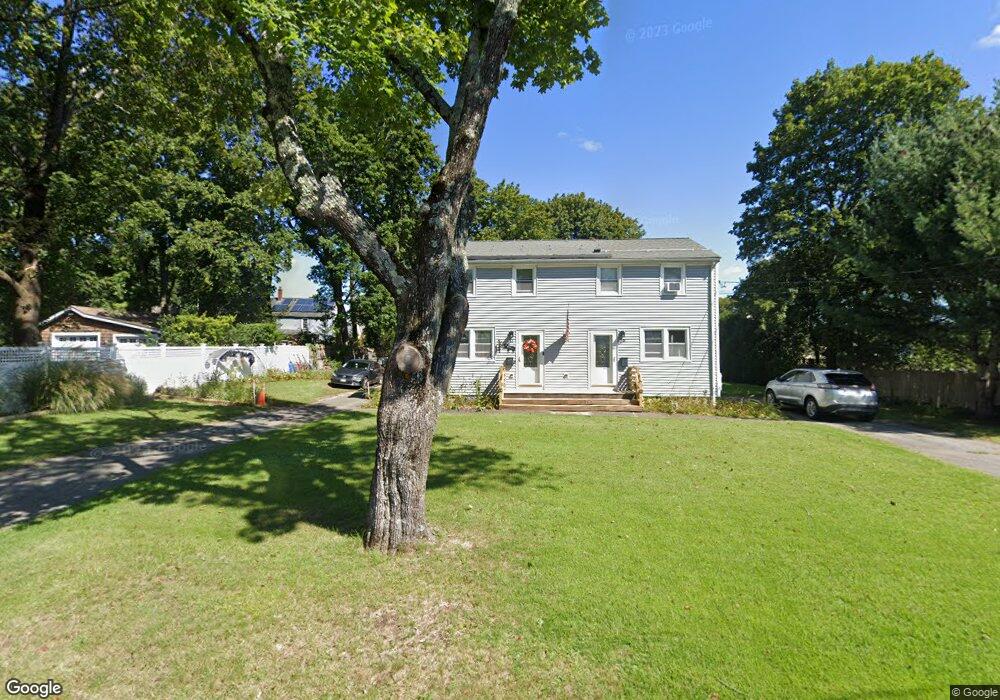
29 Vinald Rd Medfield, MA 02052
Estimated Value: $740,000 - $1,009,000
4
Beds
2
Baths
1,728
Sq Ft
$495/Sq Ft
Est. Value
About This Home
This home is located at 29 Vinald Rd, Medfield, MA 02052 and is currently estimated at $855,195, approximately $494 per square foot. 29 Vinald Rd is a home located in Norfolk County with nearby schools including Memorial School, Ralph Wheelock School, and Dale Street School.
Ownership History
Date
Name
Owned For
Owner Type
Purchase Details
Closed on
Jun 11, 2021
Sold by
Minnick Linda
Bought by
Minnick Linda
Current Estimated Value
Home Financials for this Owner
Home Financials are based on the most recent Mortgage that was taken out on this home.
Original Mortgage
$319,032
Outstanding Balance
$287,582
Interest Rate
2.9%
Mortgage Type
FHA
Estimated Equity
$567,613
Purchase Details
Closed on
Feb 6, 2009
Sold by
Minnick Guy and Minnick Linda
Bought by
Minnick Linda
Home Financials for this Owner
Home Financials are based on the most recent Mortgage that was taken out on this home.
Original Mortgage
$268,000
Interest Rate
5.2%
Mortgage Type
Purchase Money Mortgage
Purchase Details
Closed on
Apr 16, 2002
Sold by
Mitchell Rt
Bought by
Minnick Guy and Minnick Linda
Create a Home Valuation Report for This Property
The Home Valuation Report is an in-depth analysis detailing your home's value as well as a comparison with similar homes in the area
Home Values in the Area
Average Home Value in this Area
Purchase History
| Date | Buyer | Sale Price | Title Company |
|---|---|---|---|
| Minnick Linda | -- | Stewart Title | |
| Minnick Linda | -- | Stewart Title | |
| Minnick Linda | -- | -- | |
| Minnick Linda | -- | -- | |
| Minnick Linda | -- | -- | |
| Minnick Guy | $340,000 | -- | |
| Minnick Guy | $340,000 | -- |
Source: Public Records
Mortgage History
| Date | Status | Borrower | Loan Amount |
|---|---|---|---|
| Open | Minnick Linda | $319,032 | |
| Closed | Minnick Linda | $319,032 | |
| Previous Owner | Minnick Guy | $35,200 | |
| Previous Owner | Minnick Linda | $268,000 |
Source: Public Records
Tax History Compared to Growth
Tax History
| Year | Tax Paid | Tax Assessment Tax Assessment Total Assessment is a certain percentage of the fair market value that is determined by local assessors to be the total taxable value of land and additions on the property. | Land | Improvement |
|---|---|---|---|---|
| 2025 | $9,431 | $683,400 | $395,500 | $287,900 |
| 2024 | $9,244 | $631,400 | $363,500 | $267,900 |
| 2023 | $9,036 | $585,600 | $345,400 | $240,200 |
| 2022 | $8,443 | $484,700 | $327,200 | $157,500 |
| 2021 | $8,264 | $465,300 | $318,100 | $147,200 |
| 2020 | $8,155 | $457,400 | $314,500 | $142,900 |
| 2019 | $7,940 | $444,300 | $305,400 | $138,900 |
| 2018 | $7,112 | $417,600 | $286,500 | $131,100 |
| 2017 | $6,942 | $411,000 | $279,900 | $131,100 |
| 2016 | $6,782 | $404,900 | $278,100 | $126,800 |
| 2015 | $6,499 | $405,200 | $274,800 | $130,400 |
| 2014 | $5,808 | $360,300 | $229,900 | $130,400 |
Source: Public Records
Map
Nearby Homes
- 34 Frairy St
- 433 Main St Unit 4
- 8 Turtlebrook Way
- 21 Winter St
- 40 Hearthstone Dr
- 17 Fairview Rd
- 12 Belknap Rd
- 3 Shining Valley Cir
- 3 Copperwood Rd
- 22 Sunset Way Unit 22
- 4 Blacksmith Dr
- 111 Elm St
- 25 Forest St
- 161 Farm St
- 6 Village St
- 115 High St
- 2 Partridge Hill Rd
- 64 Village St
- 17 Bridle Path
- 144 Pine St