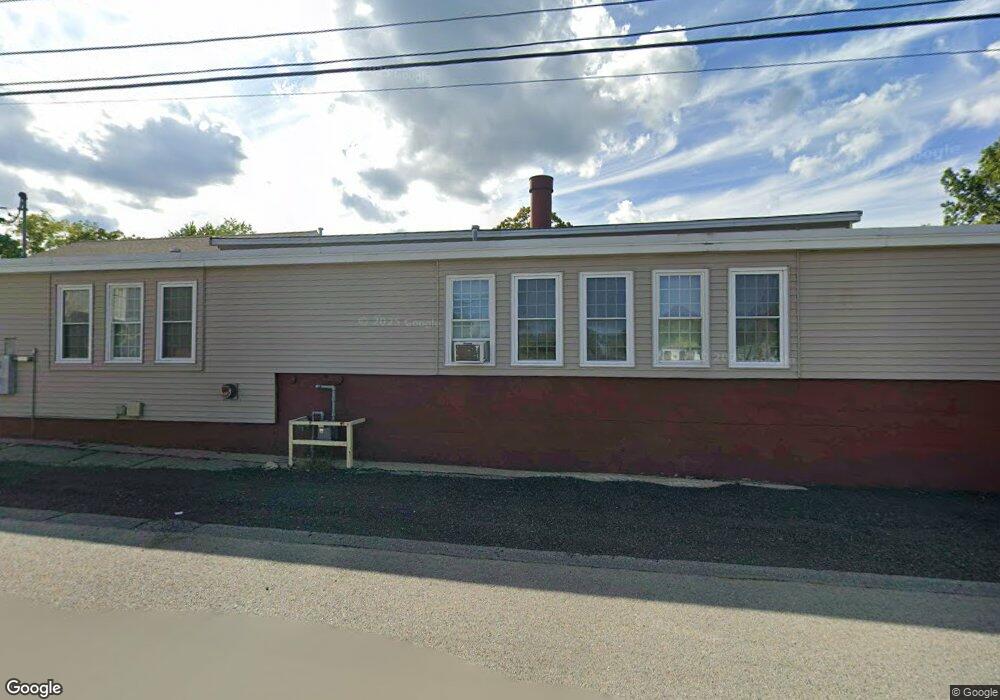
29 Vine St Middleboro, MA 02346
Estimated Value: $403,146
--
Bed
1
Bath
3,948
Sq Ft
$102/Sq Ft
Est. Value
About This Home
This home is located at 29 Vine St, Middleboro, MA 02346 and is currently estimated at $403,146, approximately $102 per square foot. 29 Vine St is a home located in Plymouth County with nearby schools including Mary K. Goode Elementary School and Mullein Hill Christian Academy.
Ownership History
Date
Name
Owned For
Owner Type
Purchase Details
Closed on
Apr 9, 2008
Sold by
Fuller William H
Bought by
Fuller Tr William H and Fuller Stephanie A
Current Estimated Value
Home Financials for this Owner
Home Financials are based on the most recent Mortgage that was taken out on this home.
Original Mortgage
$180,000
Interest Rate
5.72%
Mortgage Type
Commercial
Purchase Details
Closed on
Mar 14, 2008
Sold by
29 Vine Street Rt and Dirusso Vincent A
Bought by
Fuller William H
Home Financials for this Owner
Home Financials are based on the most recent Mortgage that was taken out on this home.
Original Mortgage
$180,000
Interest Rate
5.72%
Mortgage Type
Commercial
Purchase Details
Closed on
Jun 16, 2005
Sold by
Colonial Brass Co
Bought by
29 Vine St Rt
Create a Home Valuation Report for This Property
The Home Valuation Report is an in-depth analysis detailing your home's value as well as a comparison with similar homes in the area
Home Values in the Area
Average Home Value in this Area
Purchase History
| Date | Buyer | Sale Price | Title Company |
|---|---|---|---|
| Fuller Tr William H | -- | -- | |
| Fuller William H | $190,000 | -- | |
| 29 Vine St Rt | $100,000 | -- |
Source: Public Records
Mortgage History
| Date | Status | Borrower | Loan Amount |
|---|---|---|---|
| Open | 29 Vine St Rt | $186,500 | |
| Closed | 29 Vine St Rt | $180,000 |
Source: Public Records
Tax History Compared to Growth
Tax History
| Year | Tax Paid | Tax Assessment Tax Assessment Total Assessment is a certain percentage of the fair market value that is determined by local assessors to be the total taxable value of land and additions on the property. | Land | Improvement |
|---|---|---|---|---|
| 2025 | $3,783 | $266,200 | $94,400 | $171,800 |
| 2024 | $3,820 | $266,200 | $94,400 | $171,800 |
| 2023 | $3,861 | $255,700 | $83,900 | $171,800 |
| 2022 | $3,936 | $241,000 | $83,900 | $157,100 |
| 2021 | $3,404 | $197,200 | $69,900 | $127,300 |
| 2020 | $3,325 | $197,200 | $69,900 | $127,300 |
| 2019 | $3,242 | $197,200 | $69,900 | $127,300 |
| 2018 | $3,506 | $211,600 | $69,900 | $141,700 |
| 2017 | $3,549 | $211,600 | $69,900 | $141,700 |
| 2016 | $3,291 | $194,300 | $69,900 | $124,400 |
| 2015 | $3,258 | $194,300 | $69,900 | $124,400 |
Source: Public Records
Map
Nearby Homes