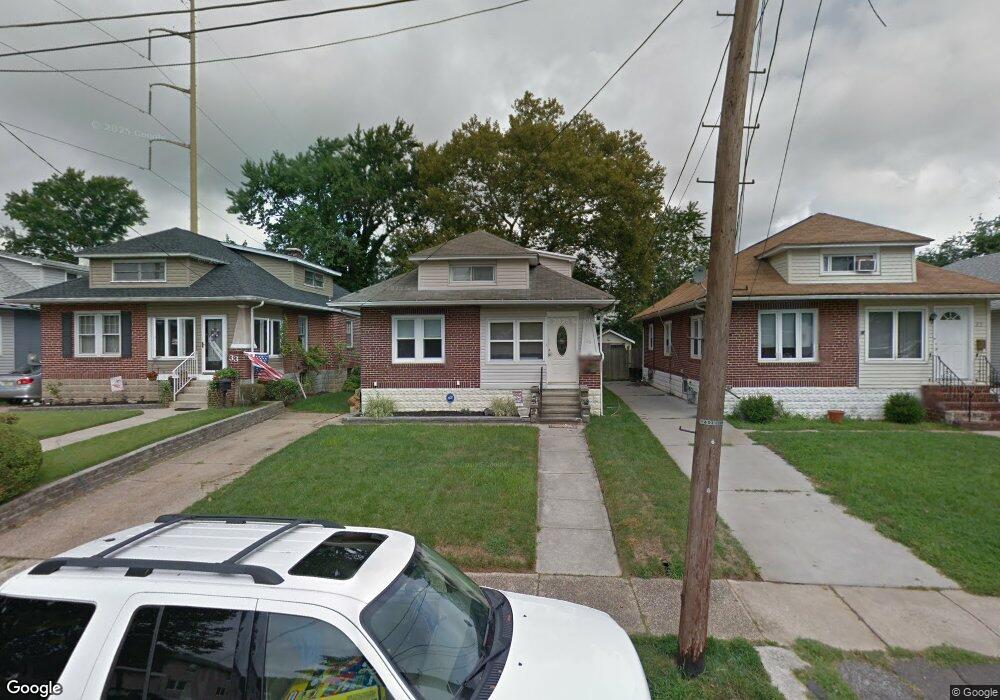
29 W 2nd Ave Runnemede, NJ 08078
Estimated Value: $299,000 - $327,000
3
Beds
2
Baths
1,339
Sq Ft
$230/Sq Ft
Est. Value
About This Home
This home is located at 29 W 2nd Ave, Runnemede, NJ 08078 and is currently estimated at $308,549, approximately $230 per square foot. 29 W 2nd Ave is a home located in Camden County with nearby schools including Mary E. Volz Elementary School, Bingham Elementary School, and Triton High School.
Ownership History
Date
Name
Owned For
Owner Type
Purchase Details
Closed on
May 13, 2022
Sold by
Copes Shaun M
Bought by
Miller Steven W and Smith Karalee A
Current Estimated Value
Home Financials for this Owner
Home Financials are based on the most recent Mortgage that was taken out on this home.
Original Mortgage
$227,950
Outstanding Balance
$216,274
Interest Rate
5.11%
Mortgage Type
New Conventional
Estimated Equity
$92,275
Purchase Details
Closed on
Oct 16, 2008
Sold by
Scafide Robert
Bought by
Copes Shaun and Digiugno Andrea
Home Financials for this Owner
Home Financials are based on the most recent Mortgage that was taken out on this home.
Original Mortgage
$155,448
Interest Rate
6.13%
Mortgage Type
FHA
Purchase Details
Closed on
Jun 26, 1998
Sold by
Estate Of Viola E Kernan
Bought by
Burns James and Burns Joan
Create a Home Valuation Report for This Property
The Home Valuation Report is an in-depth analysis detailing your home's value as well as a comparison with similar homes in the area
Home Values in the Area
Average Home Value in this Area
Purchase History
| Date | Buyer | Sale Price | Title Company |
|---|---|---|---|
| Miller Steven W | $235,000 | Federation Title | |
| Miller Steven W | $235,000 | Federation Title | |
| Copes Shaun | $157,500 | -- | |
| Burns James | $70,000 | -- |
Source: Public Records
Mortgage History
| Date | Status | Borrower | Loan Amount |
|---|---|---|---|
| Open | Miller Steven W | $227,950 | |
| Closed | Miller Steven W | $227,950 | |
| Previous Owner | Copes Shaun | $155,448 |
Source: Public Records
Tax History
| Year | Tax Paid | Tax Assessment Tax Assessment Total Assessment is a certain percentage of the fair market value that is determined by local assessors to be the total taxable value of land and additions on the property. | Land | Improvement |
|---|---|---|---|---|
| 2025 | $5,461 | $121,200 | $41,900 | $79,300 |
| 2024 | $5,295 | $121,200 | $41,900 | $79,300 |
Source: Public Records
Map
Nearby Homes
- 29 W 4th Ave
- 311 Bowers Ave
- 60 N Oakland Ave
- 38 Robert Dr
- 206 W 5th Ave
- 102 W Clements Bridge Rd
- 408 W 3rd Ave
- 112 Lindsey Ave
- 37 S Read Ave
- 232 Garden Terrace
- 524 Hirsch Ave
- 850 Orchard Ave
- 14 E Evesham Rd
- 23 E 10th Ave
- 1050 Woodland Ave
- 534 Blanchard Ave
- 411 Center Ave
- 1042 Central Ave
- 30 12th Ave
- 400 Jefferson Ct
Your Personal Tour Guide
Ask me questions while you tour the home.