
29 W Alexander Loop West Alexander, PA 15376
Donegal Township NeighborhoodEstimated payment $962/month
Total Views
34,811
7.59
Acres
$21,739
Price per Acre
330,620
Sq Ft Lot
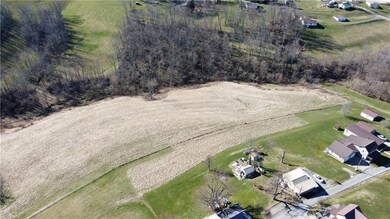
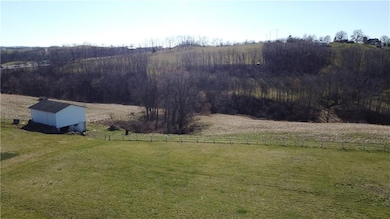
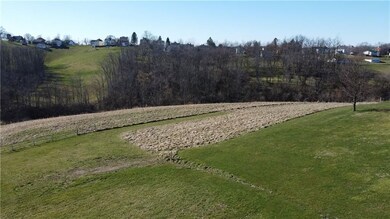
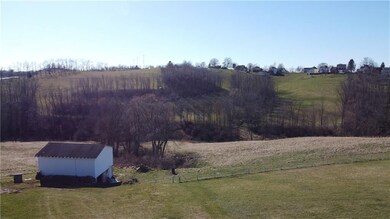
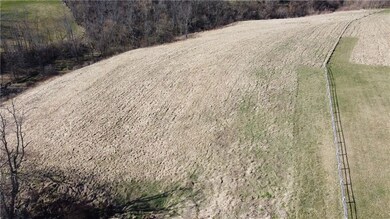
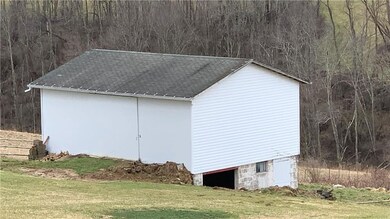
About This Lot
Large, flat lot with all public utilities available. Survey has been completed and the lot has been staked. Flat home site to build your future home. Area was formerly used as a farm for both cows and hay. There is fencing for animals if desired. There is additionally a 2-story barn for large equipment storage or for animals. The land could also be developed for several homes with walk-out basements, overlooking the hillside. Two natural springs on site. This homesite has gorgeous, wide open views to enjoy for years to come! All utilities including public sewer and water.
Listing Provided By

Property Details
Property Type
- Land
Est. Annual Taxes
- $1,101
Lot Details
- Perimeter Fence
- Current uses include grazing
- Potential uses include grazing, residential single
Farming
- Pasture
Map
Create a Home Valuation Report for This Property
The Home Valuation Report is an in-depth analysis detailing your home's value as well as a comparison with similar homes in the area
Home Values in the Area
Average Home Value in this Area
Tax History
| Year | Tax Paid | Tax Assessment Tax Assessment Total Assessment is a certain percentage of the fair market value that is determined by local assessors to be the total taxable value of land and additions on the property. | Land | Improvement |
|---|---|---|---|---|
| 2025 | $1,101 | $56,700 | $54,500 | $2,200 |
| 2024 | $947 | $56,700 | $54,500 | $2,200 |
| 2023 | $1,101 | $56,700 | $54,500 | $2,200 |
| 2022 | $2,136 | $127,800 | $9,300 | $118,500 |
| 2021 | $2,100 | $129,300 | $10,800 | $118,500 |
| 2020 | $2,047 | $129,300 | $10,800 | $118,500 |
| 2019 | $2,047 | $129,300 | $10,800 | $118,500 |
| 2018 | $1,990 | $129,300 | $10,800 | $118,500 |
| 2017 | $228 | $129,300 | $10,800 | $118,500 |
| 2016 | $228 | $9,168 | $485 | $8,683 |
| 2015 | -- | $9,168 | $485 | $8,683 |
| 2014 | $228 | $9,168 | $485 | $8,683 |
| 2013 | $228 | $9,168 | $485 | $8,683 |
Source: Public Records
Property History
| Date | Event | Price | List to Sale | Price per Sq Ft | Prior Sale |
|---|---|---|---|---|---|
| 08/15/2024 08/15/24 | For Sale | $165,000 | -43.1% | -- | |
| 10/06/2023 10/06/23 | Sold | $290,000 | -3.0% | $195 / Sq Ft | View Prior Sale |
| 03/15/2023 03/15/23 | For Sale | $299,000 | -- | $201 / Sq Ft |
Purchase History
| Date | Type | Sale Price | Title Company |
|---|---|---|---|
| Special Warranty Deed | -- | None Listed On Document | |
| Deed | $280,000 | Peacock Keller Llp | |
| Interfamily Deed Transfer | -- | None Available | |
| Interfamily Deed Transfer | -- | None Available |
Source: Public Records
Nearby Homes
- Lot 3 W Alexander Loop
- 631 Dry Ridge Rd
- 106 Doves Lodge
- 0 Warwick Dr
- 0 Shaffer Ln Unit 1707472
- 65 Butterfly Ct
- 91 Logan Dr
- 220 Main Rd
- 0 W Alexander Rd
- 0 Wilhelm Rd
- 1290 W Alexander Rd
- 839 W Alexander Rd
- 721 McGraws Run Rd
- 125 Jb Acres Ln
- 180 G C & P Rd
- 71 Henry Rd
- 1938 Beham Ridge Rd
- 295 Ooga Ln
- TBD Ooga Ln
- 102 Klages Rd
- 1 Richey Ln
- 113 MacAllan Ln
- 480 Boone Hedges Rd
- 2448 National Rd
- 2379 Lumber Ave Unit 3
- 2357 Overbrook Ave Unit Overbrook
- 21 Oakland Ave Unit 3
- 151 Elm St Unit 1
- 10 Rockledge Rd Unit A
- 165 Edgwood St Unit 2nd Floor
- 1414 National Rd
- 49 Lynwood Ave
- 16 Edgwood St Unit Second Floor
- 93 Westgate Dr
- 437 Richland Ave
- 147 N 16th St
- 29 Elm Ln
- 596 National Rd
- 700 Northwood Ct Unit 202
- 1411 McColloch St Unit 2B