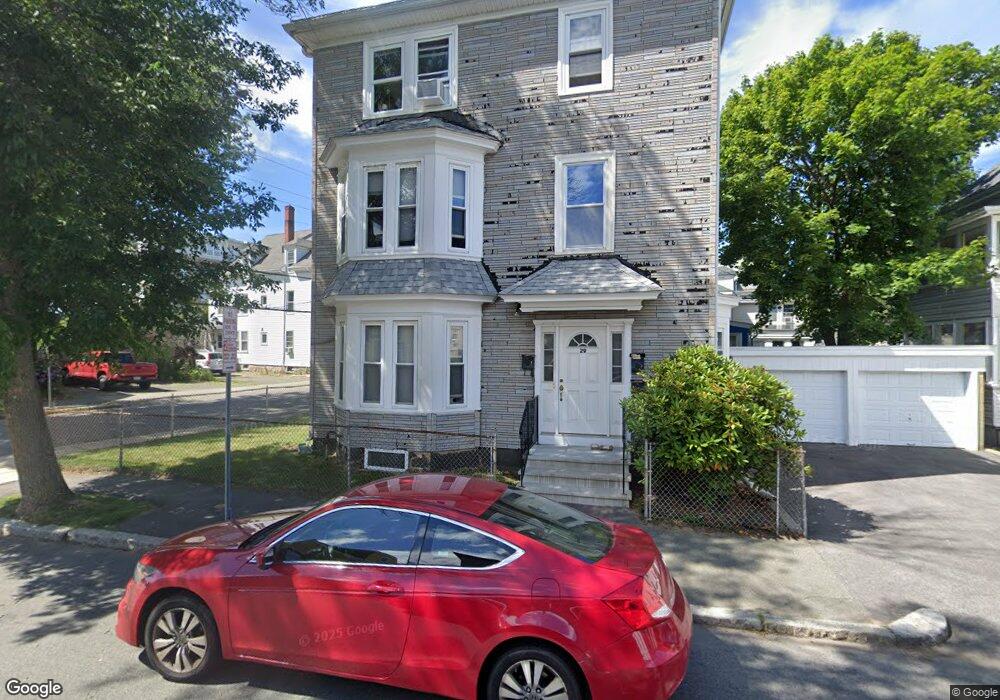
29 W Dane St Beverly, MA 01915
Downtown Beverly NeighborhoodEstimated Value: $742,029 - $988,000
6
Beds
3
Baths
3,016
Sq Ft
$298/Sq Ft
Est. Value
About This Home
This home is located at 29 W Dane St, Beverly, MA 01915 and is currently estimated at $900,007, approximately $298 per square foot. 29 W Dane St is a home located in Essex County with nearby schools including Beverly High School, Mrs Alexander's School, and Shore Country Day School.
Ownership History
Date
Name
Owned For
Owner Type
Purchase Details
Closed on
May 15, 2018
Sold by
Digenova Elvasio and Digenova Giuliana
Bought by
Marsica Llc
Current Estimated Value
Purchase Details
Closed on
Apr 29, 1994
Sold by
Prime Rt and Booras
Bought by
Digenova Elvasio and Digenova Giuliana
Home Financials for this Owner
Home Financials are based on the most recent Mortgage that was taken out on this home.
Original Mortgage
$100,000
Interest Rate
7.7%
Mortgage Type
Purchase Money Mortgage
Create a Home Valuation Report for This Property
The Home Valuation Report is an in-depth analysis detailing your home's value as well as a comparison with similar homes in the area
Home Values in the Area
Average Home Value in this Area
Purchase History
| Date | Buyer | Sale Price | Title Company |
|---|---|---|---|
| Marsica Llc | -- | -- | |
| Digenova Elvasio | $179,900 | -- |
Source: Public Records
Mortgage History
| Date | Status | Borrower | Loan Amount |
|---|---|---|---|
| Previous Owner | Digenova Elvasio | $100,000 |
Source: Public Records
Tax History Compared to Growth
Tax History
| Year | Tax Paid | Tax Assessment Tax Assessment Total Assessment is a certain percentage of the fair market value that is determined by local assessors to be the total taxable value of land and additions on the property. | Land | Improvement |
|---|---|---|---|---|
| 2025 | $8,205 | $746,600 | $353,100 | $393,500 |
| 2024 | $7,664 | $682,500 | $289,000 | $393,500 |
| 2023 | $7,356 | $653,300 | $259,800 | $393,500 |
| 2022 | $7,168 | $589,000 | $204,900 | $384,100 |
| 2021 | $7,363 | $579,800 | $195,700 | $384,100 |
| 2020 | $6,960 | $542,500 | $184,800 | $357,700 |
| 2019 | $6,703 | $507,400 | $158,200 | $349,200 |
| 2018 | $5,836 | $429,100 | $128,900 | $300,200 |
| 2017 | $5,082 | $355,900 | $95,200 | $260,700 |
| 2016 | $4,796 | $333,300 | $95,200 | $238,100 |
Source: Public Records
Map
Nearby Homes
- 348 Rantoul St Unit 202
- 19 Pond St
- The Cabot Collection
- 261 Rantoul St
- 70 Chase St
- 142 Elliott St
- 34 Beckford St Unit B
- 20 Ropes St
- 9 Swan St Unit 1
- 9 Swan St Unit 3
- 9 Swan St Unit 2
- 9.5 Fayette Unit 9.5
- 12 Fayette St Unit 4
- 60 Rantoul St Unit 711N
- 19 Cedar St
- 38 Sohier Rd
- 16 Lyman St
- 21 Summit Ave Unit 2
- 40 & 40R Stone St
- 43 Front St