
Seller's Agent in 2024
Kristin Coletti
William Raveis R.E. & Home Services
(781) 264-4749
44 Total Sales
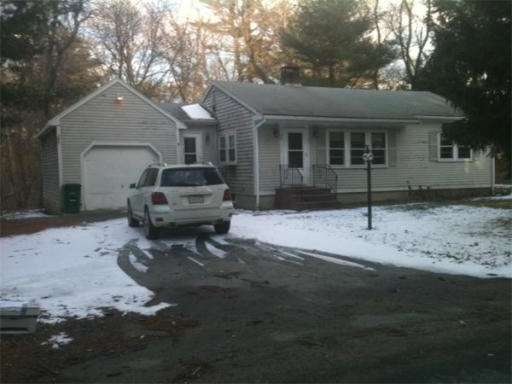
All showings temporarily suspended. Calling all investors, excellent location for instant equity.
Last Agent to Sell the Property
Richard Hickey
Celebration Real Estate Listed on: 02/05/2013
Home Type
Single Family
Est. Annual Taxes
$6,010
Year Built
1950
Lot Details
0
| Date | Type | Sale Price | Title Company |
|---|---|---|---|
| Not Resolvable | $332,000 | -- | |
| Land Court Massachusetts | $320,000 | -- | |
| Land Court Massachusetts | $320,000 | -- | |
| Land Court Massachusetts | $204,900 | -- | |
| Leasehold Conv With Agreement Of Sale Fee Purchase Hawaii | $128,000 | -- |
| Date | Status | Loan Amount | Loan Type |
|---|---|---|---|
| Open | $546,502 | Purchase Money Mortgage | |
| Closed | $546,502 | Purchase Money Mortgage | |
| Closed | $475,000 | Purchase Money Mortgage | |
| Closed | $41,000 | Credit Line Revolving | |
| Closed | $340,050 | Stand Alone Refi Refinance Of Original Loan | |
| Previous Owner | $265,000 | FHA | |
| Previous Owner | $164,957 | New Conventional |
| Date | Event | Price | Change | Sq Ft Price |
|---|---|---|---|---|
| 12/04/2024 12/04/24 | Sold | $535,000 | +0.9% | $329 / Sq Ft |
| 10/12/2024 10/12/24 | Pending | -- | -- | -- |
| 10/02/2024 10/02/24 | For Sale | $530,000 | +6.0% | $326 / Sq Ft |
| 10/30/2023 10/30/23 | Sold | $500,000 | 0.0% | $308 / Sq Ft |
| 08/22/2023 08/22/23 | For Sale | $500,000 | +50.6% | $308 / Sq Ft |
| 11/21/2019 11/21/19 | Sold | $332,000 | +3.8% | $265 / Sq Ft |
| 10/07/2019 10/07/19 | Pending | -- | -- | -- |
| 09/30/2019 09/30/19 | For Sale | $320,000 | +12.3% | $256 / Sq Ft |
| 03/01/2017 03/01/17 | Sold | $285,000 | -4.7% | $278 / Sq Ft |
| 01/06/2017 01/06/17 | Pending | -- | -- | -- |
| 12/30/2016 12/30/16 | Price Changed | $299,000 | -3.5% | $292 / Sq Ft |
| 12/29/2016 12/29/16 | For Sale | $310,000 | 0.0% | $303 / Sq Ft |
| 12/21/2016 12/21/16 | Pending | -- | -- | -- |
| 12/13/2016 12/13/16 | For Sale | $310,000 | +84.5% | $303 / Sq Ft |
| 05/30/2013 05/30/13 | Sold | $168,000 | -1.1% | $164 / Sq Ft |
| 02/07/2013 02/07/13 | Pending | -- | -- | -- |
| 02/05/2013 02/05/13 | For Sale | $169,900 | -- | $166 / Sq Ft |
| Year | Tax Paid | Tax Assessment Tax Assessment Total Assessment is a certain percentage of the fair market value that is determined by local assessors to be the total taxable value of land and additions on the property. | Land | Improvement |
|---|---|---|---|---|
| 2025 | $6,010 | $500,000 | $272,800 | $227,200 |
| 2024 | $5,167 | $429,500 | $246,900 | $182,600 |
| 2023 | $5,158 | $405,500 | $234,700 | $170,800 |
| 2022 | $4,846 | $342,500 | $193,600 | $148,900 |
| 2021 | $4,616 | $316,600 | $181,100 | $135,500 |
| 2020 | $4,367 | $301,400 | $177,100 | $124,300 |
| 2019 | $4,237 | $290,200 | $172,800 | $117,400 |
| 2018 | $4,087 | $274,500 | $165,400 | $109,100 |
| 2017 | $4,039 | $267,500 | $157,500 | $110,000 |
| 2016 | $3,919 | $256,800 | $145,900 | $110,900 |
| 2015 | $3,681 | $249,700 | $138,000 | $111,700 |
Seller's Agent in 2024
Kristin Coletti
William Raveis R.E. & Home Services
(781) 264-4749
44 Total Sales
Buyer's Agent in 2024
Paul Coleman
Lamacchia Realty, Inc.
(857) 998-9623
149 Total Sales
Seller's Agent in 2023
Richard Baker
Compass
(857) 267-1956
86 Total Sales
Buyer's Agent in 2023
Beth Tassinari
Century 21 Tassinari & Assoc.
(508) 747-1258
125 Total Sales
Buyer's Agent in 2019
Andrew Brodie
Jill & Co. Realty Group
(978) 853-0143
11 Total Sales
Seller's Agent in 2017
Sue Mulcare
Lamacchia Realty, Inc.
(617) 943-3245
Source: MLS Property Information Network (MLS PIN)
MLS Number: 71479870
APN: PEMB-000010B-000000-000020
Disclaimer: Certain information contained herein is derived from information provided by parties other than Homes.com. All information provided is deemed reliable, but is not guaranteed to be accurate and should be independently verified.
![]() The property listing data and information, or the Images, set forth herein were provided to MLS Property Information Network, Inc. from third party sources, including sellers, lessors and public records, and were compiled by MLS Property Information Network, Inc. The property listing data and information, and the Images, are for the personal, non-commercial use of consumers having a good faith interest in purchasing or leasing listed properties of the type displayed to them and may not be used for any purpose other than to identify prospective properties which such consumers may have a good faith interest in purchasing or leasing. MLS Property Information Network, Inc. and its subscribers disclaim any and all representations and warranties as to the accuracy of the property listing data and information, or as to the accuracy of any of the Images, set forth herein.
The property listing data and information, or the Images, set forth herein were provided to MLS Property Information Network, Inc. from third party sources, including sellers, lessors and public records, and were compiled by MLS Property Information Network, Inc. The property listing data and information, and the Images, are for the personal, non-commercial use of consumers having a good faith interest in purchasing or leasing listed properties of the type displayed to them and may not be used for any purpose other than to identify prospective properties which such consumers may have a good faith interest in purchasing or leasing. MLS Property Information Network, Inc. and its subscribers disclaim any and all representations and warranties as to the accuracy of the property listing data and information, or as to the accuracy of any of the Images, set forth herein.