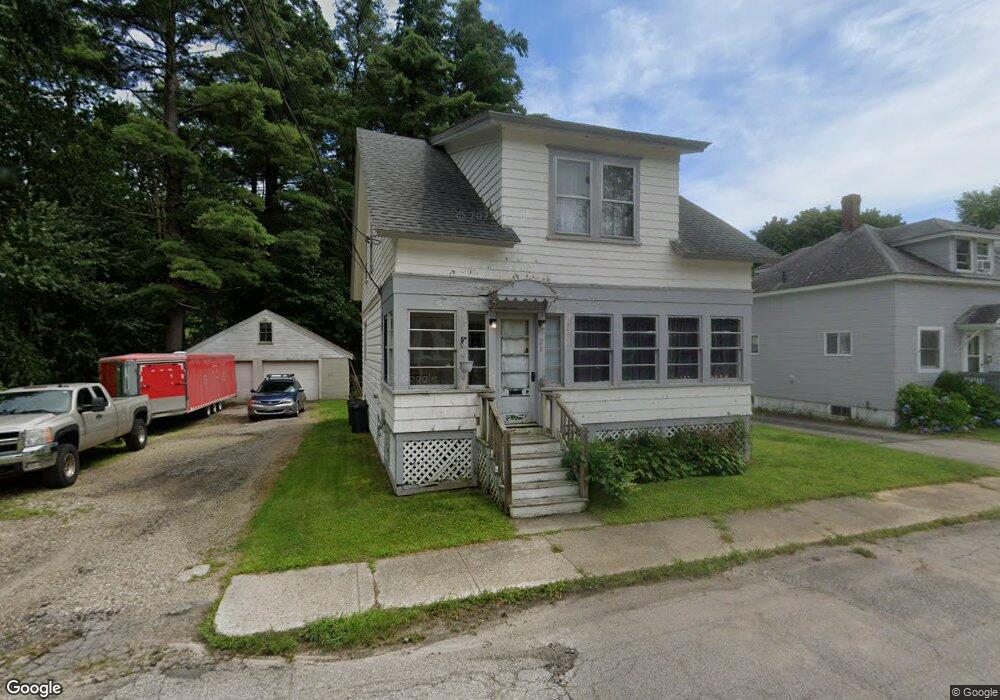
29 Weeman St Springvale, ME 04083
Estimated Value: $309,708 - $324,000
3
Beds
1
Bath
1,260
Sq Ft
$253/Sq Ft
Est. Value
About This Home
This home is located at 29 Weeman St, Springvale, ME 04083 and is currently estimated at $318,677, approximately $252 per square foot. 29 Weeman St is a home located in York County with nearby schools including St Thomas Consolidated School and Sanford Christian Academy.
Ownership History
Date
Name
Owned For
Owner Type
Purchase Details
Closed on
Jun 9, 2014
Sold by
Us Bank Na Tr
Bought by
Welch Daniel
Current Estimated Value
Home Financials for this Owner
Home Financials are based on the most recent Mortgage that was taken out on this home.
Original Mortgage
$76,000
Outstanding Balance
$58,853
Interest Rate
5%
Mortgage Type
Adjustable Rate Mortgage/ARM
Estimated Equity
$259,824
Purchase Details
Closed on
Oct 2, 2013
Sold by
Us Bank Na Tr
Bought by
Us Bank Na Tr
Create a Home Valuation Report for This Property
The Home Valuation Report is an in-depth analysis detailing your home's value as well as a comparison with similar homes in the area
Home Values in the Area
Average Home Value in this Area
Purchase History
| Date | Buyer | Sale Price | Title Company |
|---|---|---|---|
| Welch Daniel | -- | -- | |
| Welch Daniel | -- | -- | |
| Us Bank Na Tr | -- | -- | |
| Us Bank Na Tr | -- | -- |
Source: Public Records
Mortgage History
| Date | Status | Borrower | Loan Amount |
|---|---|---|---|
| Open | Welch Daniel | $76,000 | |
| Closed | Us Bank Na Tr | $76,000 |
Source: Public Records
Tax History
| Year | Tax Paid | Tax Assessment Tax Assessment Total Assessment is a certain percentage of the fair market value that is determined by local assessors to be the total taxable value of land and additions on the property. | Land | Improvement |
|---|---|---|---|---|
| 2025 | $3,512 | $205,400 | $37,600 | $167,800 |
| 2024 | $3,315 | $205,400 | $37,600 | $167,800 |
| 2023 | $3,084 | $203,700 | $37,600 | $166,100 |
| 2022 | $3,015 | $203,700 | $37,600 | $166,100 |
| 2021 | $3,002 | $165,100 | $37,600 | $127,500 |
| 2020 | $3,056 | $151,600 | $37,600 | $114,000 |
| 2019 | $2,817 | $136,100 | $37,600 | $98,500 |
| 2018 | $2,710 | $132,200 | $37,600 | $94,600 |
| 2017 | $2,622 | $126,400 | $37,600 | $88,800 |
| 2016 | $2,667 | $117,300 | $37,500 | $79,800 |
| 2015 | $2,513 | $114,000 | $38,000 | $76,000 |
| 2014 | $2,465 | $114,000 | $38,000 | $76,000 |
| 2013 | -- | $114,000 | $38,000 | $76,000 |
Source: Public Records
Map
Nearby Homes
Your Personal Tour Guide
Ask me questions while you tour the home.