Estimated Value: $230,672 - $340,000
--
Bed
--
Bath
1,268
Sq Ft
$216/Sq Ft
Est. Value
About This Home
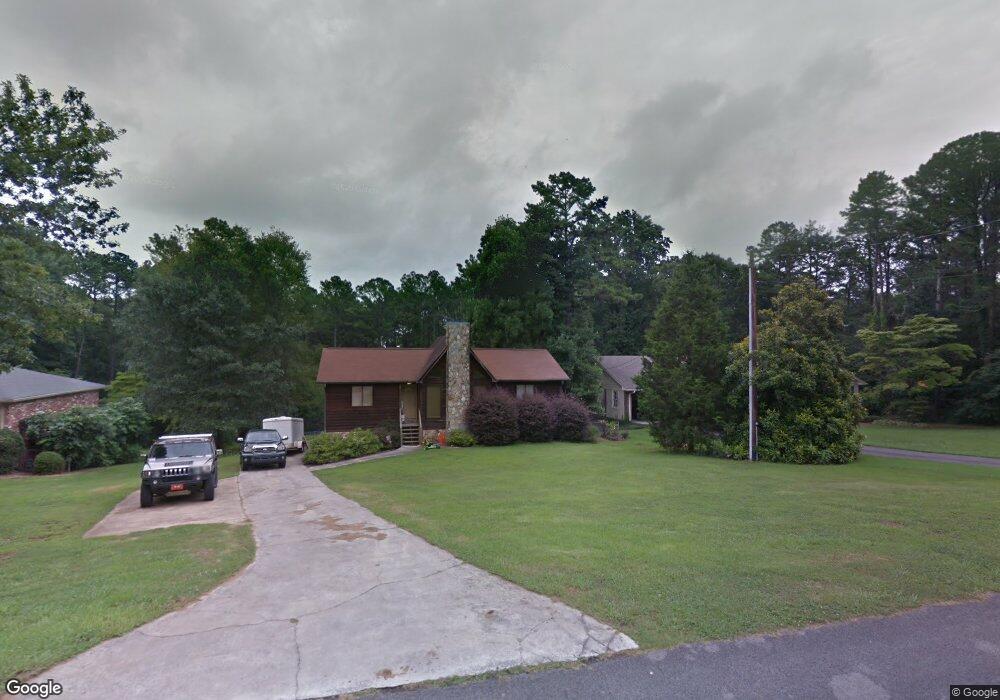
This home is located at 29 Wellington Way SE, Rome, GA 30161 and is currently estimated at $274,418, approximately $216 per square foot. 29 Wellington Way SE is a home located in Floyd County with nearby schools including Pepperell Middle School, Pepperell High School, and Montessori School of Rome.
Ownership History
Date
Name
Owned For
Owner Type
Purchase Details
Closed on
May 14, 2002
Sold by
Patton C Ronald
Bought by
Starr Sizemore W and Starr Newberry C
Current Estimated Value
Purchase Details
Closed on
Nov 28, 2001
Sold by
Coffia Michele
Bought by
Patton C Ronald
Purchase Details
Closed on
Jul 24, 1997
Sold by
Roper Gladys J
Bought by
Coffia Michele
Purchase Details
Closed on
May 19, 1997
Sold by
Blackstock Bill
Bought by
Roper Gladys J
Purchase Details
Closed on
Feb 18, 1972
Sold by
Roper Paul E and Roper Gladys
Bought by
Blackstock Bill
Purchase Details
Closed on
Jan 18, 1972
Sold by
Roper Paul E and Gladys Jolly
Bought by
Roper Paul E and Roper Gladys
Purchase Details
Closed on
Jan 17, 1972
Sold by
Johnson Lyrlene G
Bought by
Roper Paul E and Gladys Jolly
Purchase Details
Closed on
Dec 5, 1966
Sold by
Johnson F L
Bought by
Johnson Lyrlene G
Purchase Details
Closed on
Jul 4, 1962
Bought by
Johnson F L
Create a Home Valuation Report for This Property
The Home Valuation Report is an in-depth analysis detailing your home's value as well as a comparison with similar homes in the area
Home Values in the Area
Average Home Value in this Area
Purchase History
| Date | Buyer | Sale Price | Title Company |
|---|---|---|---|
| Starr Sizemore W | $132,500 | -- | |
| Patton C Ronald | $105,000 | -- | |
| Coffia Michele | $10,000 | -- | |
| Roper Gladys J | -- | -- | |
| Blackstock Bill | $1,600 | -- | |
| Roper Paul E | $3,000 | -- | |
| Roper Paul E | -- | -- | |
| Johnson Lyrlene G | -- | -- | |
| Johnson F L | -- | -- |
Source: Public Records
Tax History Compared to Growth
Tax History
| Year | Tax Paid | Tax Assessment Tax Assessment Total Assessment is a certain percentage of the fair market value that is determined by local assessors to be the total taxable value of land and additions on the property. | Land | Improvement |
|---|---|---|---|---|
| 2024 | $2,278 | $100,322 | $7,412 | $92,910 |
| 2023 | $2,372 | $92,902 | $6,540 | $86,362 |
| 2022 | $2,100 | $79,948 | $5,232 | $74,716 |
| 2021 | $2,033 | $74,490 | $5,232 | $69,258 |
| 2020 | $1,902 | $66,689 | $4,142 | $62,547 |
| 2019 | $1,758 | $60,217 | $4,142 | $56,075 |
| 2018 | $1,702 | $57,986 | $4,142 | $53,844 |
| 2017 | $1,671 | $56,850 | $4,142 | $52,708 |
| 2016 | $1,674 | $56,280 | $4,120 | $52,160 |
| 2015 | $1,734 | $59,425 | $4,120 | $55,305 |
| 2014 | $1,734 | $59,425 | $4,120 | $55,305 |
Source: Public Records
Map
Nearby Homes
- 18 Wellington Way SE
- 36 Coventry Dr SE
- 38 Coventry Dr SE
- 14 Wellington Way SE
- 35 Cumberland Dr SE
- 211 Chateau Dr SE
- 0 Wellington Way SE Unit 7374604
- 0 Wellington Way SE Unit 7374602
- 0 Wellington Way SE Unit 20180069
- 0 Wellington Way SE Unit 20180068
- 22 Coventry Dr SE
- 20 Coventry Dr SE
- 11 Cambridge Dr SE
- 519 Dr SE
- 85 Cambridge Dr SE
- 52 Twickenham Rd SE
- 15 Saddlebrook Dr SE
- 3 Belmont Ct SE
- 18 Devonshire Dr SE
- 14 Warwick Way SE
- 27 Wellington Way SE
- 31 Wellington Way SE
- 31 Wellington Way SE
- 25 Wellington Way SE
- 34 Wellington Way SE
- 36 Wellington Way SE
- 36 Wellington Way SE
- 32 Wellington Way SE
- 32 Wellington Way SE
- 21 Wellington Way SE
- 35 Wellington Way SE
- 35 Wellington Way SE
- 23 Wellington Way SE
- 22 Twickenham Rd SE
- 37 Wellington Way SE
- 24 Twickenham Rd SE
- 19 Wellington Way SE
- 26 Twickenham Rd SE
- 26 Wellington Way SE
- 30 Wellington Way SE