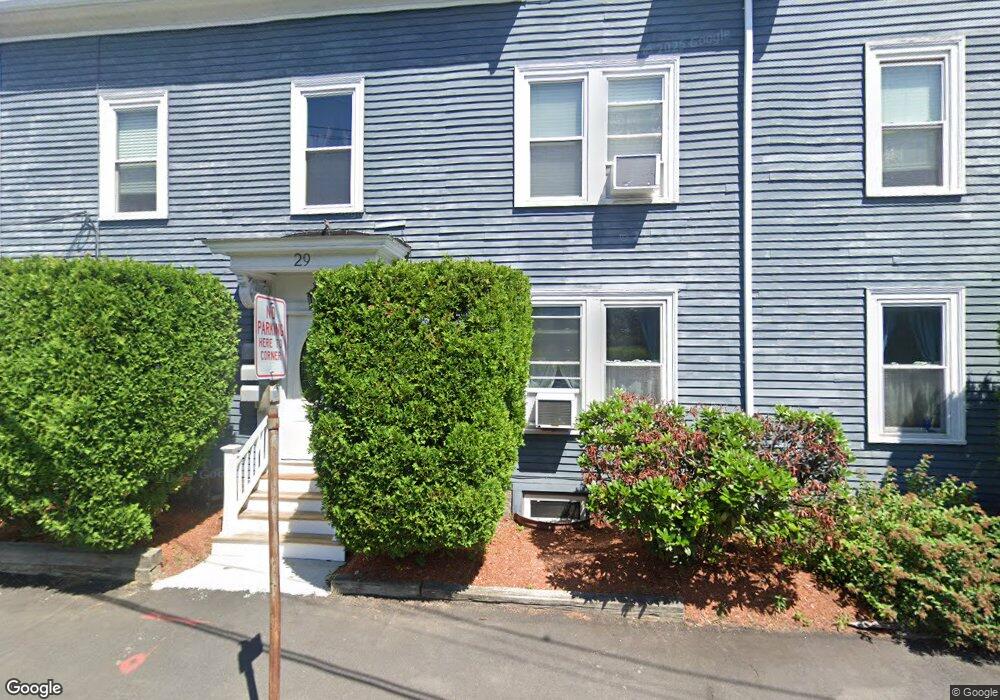
29 Wellman St Unit 2 Beverly, MA 01915
Downtown Beverly NeighborhoodEstimated Value: $403,000 - $429,000
2
Beds
1
Bath
876
Sq Ft
$476/Sq Ft
Est. Value
About This Home
This home is located at 29 Wellman St Unit 2, Beverly, MA 01915 and is currently estimated at $416,783, approximately $475 per square foot. 29 Wellman St Unit 2 is a home located in Essex County with nearby schools including Beverly High School, Mrs Alexander's School, and Shore Country Day School.
Ownership History
Date
Name
Owned For
Owner Type
Purchase Details
Closed on
Aug 4, 2016
Sold by
Ciarametaro Matteo M
Bought by
29-2 Wellman Rt
Current Estimated Value
Purchase Details
Closed on
Mar 4, 2008
Sold by
Bank Of New York
Bought by
Ciarametaro Matteo M
Home Financials for this Owner
Home Financials are based on the most recent Mortgage that was taken out on this home.
Original Mortgage
$163,400
Interest Rate
5.8%
Mortgage Type
Purchase Money Mortgage
Purchase Details
Closed on
Dec 12, 2007
Sold by
Macpherson Linda C and Bank Of New York
Bought by
Bank Of New York
Purchase Details
Closed on
Oct 20, 2000
Sold by
Fernandes Gaudencio D
Bought by
Macpherson Linda C
Purchase Details
Closed on
Sep 10, 1993
Sold by
Citicorp Mtg Inc
Bought by
Fernandes Gaudencio D
Purchase Details
Closed on
May 4, 1993
Sold by
Presutti Diane and Citicorp Mtg Inc
Bought by
Citicorp Mtg Inc
Purchase Details
Closed on
Oct 27, 1989
Sold by
Boches Scott
Bought by
Presutti Diane
Create a Home Valuation Report for This Property
The Home Valuation Report is an in-depth analysis detailing your home's value as well as a comparison with similar homes in the area
Home Values in the Area
Average Home Value in this Area
Purchase History
| Date | Buyer | Sale Price | Title Company |
|---|---|---|---|
| 29-2 Wellman Rt | -- | -- | |
| Ciarametaro Matteo M | $172,000 | -- | |
| Bank Of New York | $188,550 | -- | |
| Macpherson Linda C | $147,000 | -- | |
| Fernandes Gaudencio D | $62,500 | -- | |
| Citicorp Mtg Inc | $118,237 | -- | |
| Presutti Diane | $125,000 | -- |
Source: Public Records
Mortgage History
| Date | Status | Borrower | Loan Amount |
|---|---|---|---|
| Previous Owner | Presutti Diane | $163,400 | |
| Previous Owner | Presutti Diane | $190,800 |
Source: Public Records
Tax History Compared to Growth
Tax History
| Year | Tax Paid | Tax Assessment Tax Assessment Total Assessment is a certain percentage of the fair market value that is determined by local assessors to be the total taxable value of land and additions on the property. | Land | Improvement |
|---|---|---|---|---|
| 2025 | $3,874 | $352,500 | $0 | $352,500 |
| 2024 | $3,658 | $325,700 | $0 | $325,700 |
| 2023 | $3,364 | $298,800 | $0 | $298,800 |
| 2022 | $3,212 | $263,900 | $0 | $263,900 |
| 2021 | $3,120 | $245,700 | $0 | $245,700 |
| 2020 | $2,903 | $226,300 | $0 | $226,300 |
| 2019 | $2,799 | $211,900 | $0 | $211,900 |
| 2018 | $2,696 | $198,200 | $0 | $198,200 |
| 2017 | $2,636 | $184,600 | $0 | $184,600 |
| 2016 | $2,612 | $181,500 | $0 | $181,500 |
| 2015 | $2,561 | $181,500 | $0 | $181,500 |
Source: Public Records
Map
Nearby Homes
- 21 Summit Ave Unit 2
- 60 Rantoul St Unit 711N
- 12 Fayette St Unit 4
- 9.5 Fayette Unit 9.5
- 43 Front St
- 40 & 40R Stone St
- 7 Lothrop St
- 16 Crescent Ave
- 10 Quincy Park
- 261 Rantoul St
- 12 Thorndike St
- 123 Livingstone Ave
- 140 Livingstone Ave
- 19 Pond St
- 348 Rantoul St Unit 202
- The Cabot Collection
- 14 Lathrop St
- 142 Elliott St
- 70 Chase St
- 103 Bridge St Unit 2
- 29 Wellman St Unit 1
- 27.5 Wellman St
- 27 Wellman St
- 24 School St
- 25 School St
- 27 1/2 Wellman St
- 30 Wellman St
- 22 School St
- 21 School St
- 21 School St Unit 3
- 21 School St Unit 1
- 28 Wellman St
- 23 School St
- 23 School St Unit 2
- 25 Wellman St
- 31 Ellingwood Ct
- 27 School St
- 32 School St
- 4 River St
- 26 Wellman St