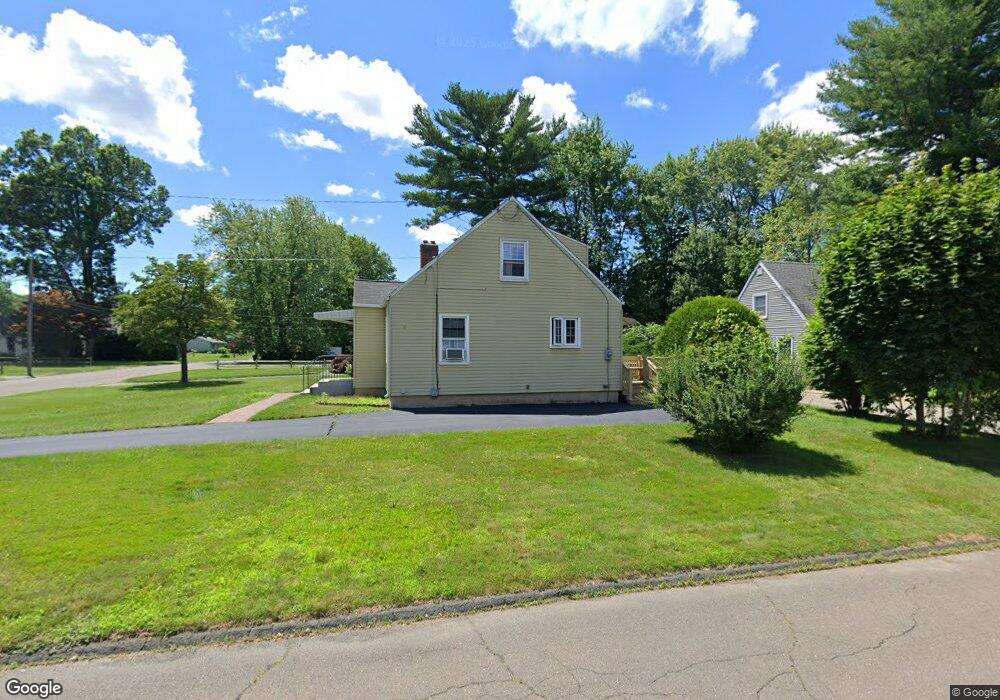
29 Wheeler Rd Wethersfield, CT 06109
Estimated Value: $358,421 - $396,000
3
Beds
1
Bath
1,297
Sq Ft
$291/Sq Ft
Est. Value
About This Home
This home is located at 29 Wheeler Rd, Wethersfield, CT 06109 and is currently estimated at $377,105, approximately $290 per square foot. 29 Wheeler Rd is a home located in Hartford County with nearby schools including Emerson-Williams School, Silas Deane Middle School, and Wethersfield High School.
Ownership History
Date
Name
Owned For
Owner Type
Purchase Details
Closed on
Nov 9, 1993
Sold by
Midura Robert Paul
Bought by
Peck Jason J and Hasty Anne H
Current Estimated Value
Home Financials for this Owner
Home Financials are based on the most recent Mortgage that was taken out on this home.
Original Mortgage
$93,000
Interest Rate
6.83%
Mortgage Type
Unknown
Create a Home Valuation Report for This Property
The Home Valuation Report is an in-depth analysis detailing your home's value as well as a comparison with similar homes in the area
Home Values in the Area
Average Home Value in this Area
Purchase History
| Date | Buyer | Sale Price | Title Company |
|---|---|---|---|
| Peck Jason J | $124,000 | -- |
Source: Public Records
Mortgage History
| Date | Status | Borrower | Loan Amount |
|---|---|---|---|
| Open | Peck Jason J | $99,100 | |
| Closed | Peck Jason J | $71,300 | |
| Closed | Peck Jason J | $14,500 | |
| Closed | Peck Jason J | $93,000 |
Source: Public Records
Tax History
| Year | Tax Paid | Tax Assessment Tax Assessment Total Assessment is a certain percentage of the fair market value that is determined by local assessors to be the total taxable value of land and additions on the property. | Land | Improvement |
|---|---|---|---|---|
| 2025 | $8,849 | $214,680 | $90,050 | $124,630 |
| 2024 | $5,804 | $134,290 | $65,090 | $69,200 |
| 2023 | $5,611 | $134,290 | $65,090 | $69,200 |
| 2022 | $5,517 | $134,290 | $65,090 | $69,200 |
| 2021 | $5,462 | $134,290 | $65,090 | $69,200 |
| 2020 | $5,464 | $134,290 | $65,090 | $69,200 |
| 2019 | $5,471 | $134,290 | $65,090 | $69,200 |
| 2018 | $5,485 | $134,500 | $61,100 | $73,400 |
| 2017 | $5,349 | $134,500 | $61,100 | $73,400 |
| 2016 | $5,184 | $134,500 | $61,100 | $73,400 |
| 2015 | $5,137 | $134,500 | $61,100 | $73,400 |
| 2014 | $4,942 | $134,500 | $61,100 | $73,400 |
Source: Public Records
Map
Nearby Homes
- 38 Wheeler Rd
- 137 Dale Rd
- 89 Merriman Rd
- 455 Brimfield Rd
- 119 Coleman Rd
- 108 Chamberlain Rd
- 35 Stillwold Dr
- 195 Middletown Ave
- 116 Wells Farm Dr
- 91 Somerset St
- 87 Somerset St
- 104 Willow St
- 0 Collier Rd
- 101 Collier Rd
- 20 Forest Dr
- 268 Fox Hill Rd
- 1 Fernwood St
- 5 Robeth Ln
- 25 Sutton Rd
- 7 Barrington Dr Unit C
Your Personal Tour Guide
Ask me questions while you tour the home.