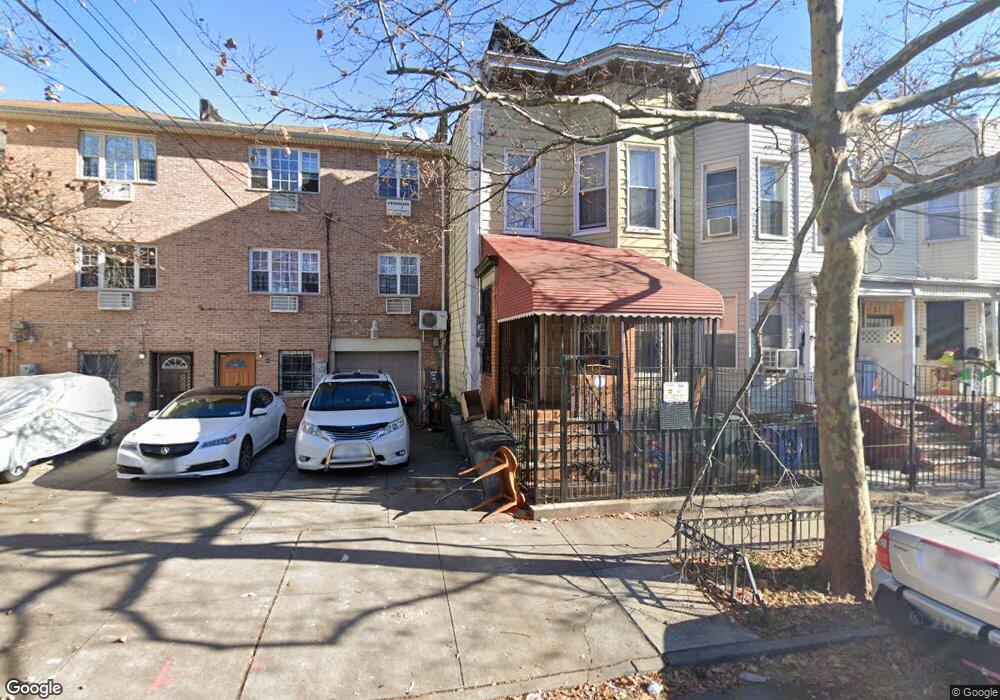
29 Wyona St Brooklyn, NY 11207
Cypress Hills NeighborhoodEstimated Value: $668,000 - $867,804
--
Bed
--
Bath
1,820
Sq Ft
$426/Sq Ft
Est. Value
About This Home
This home is located at 29 Wyona St, Brooklyn, NY 11207 and is currently estimated at $774,701, approximately $425 per square foot. 29 Wyona St is a home located in Kings County with nearby schools including P.S. 290 - Juan Morel Campos, Liberty Avenue Middle School, and Vista Academy.
Ownership History
Date
Name
Owned For
Owner Type
Purchase Details
Closed on
Mar 5, 2021
Sold by
Walker-Diallo Carolyn
Bought by
Descendants Of Greatness Revocable Livin
Current Estimated Value
Purchase Details
Closed on
May 14, 2020
Sold by
Nancy C Walker As Trustee
Bought by
Diallo Walker and Diallo Carolyn
Home Financials for this Owner
Home Financials are based on the most recent Mortgage that was taken out on this home.
Original Mortgage
$340,000
Interest Rate
3.3%
Mortgage Type
Unknown
Purchase Details
Closed on
Jun 28, 2019
Sold by
Diallo Thierno M and Walker-Diallo Receiver/Agent
Bought by
Walker-Diallo Carolyn
Purchase Details
Closed on
Oct 23, 2018
Sold by
Walker Nancy C
Bought by
Nancy C Walker As Trustee and Nancy C Walker Revocable Trust
Purchase Details
Closed on
Aug 11, 2005
Sold by
Walker Nancy
Bought by
Diallo Thierno Malal and Walker Nancy
Create a Home Valuation Report for This Property
The Home Valuation Report is an in-depth analysis detailing your home's value as well as a comparison with similar homes in the area
Home Values in the Area
Average Home Value in this Area
Purchase History
| Date | Buyer | Sale Price | Title Company |
|---|---|---|---|
| Descendants Of Greatness Revocable Livin | -- | -- | |
| Diallo Walker | -- | -- | |
| Walker-Diallo Carolyn | $42,675 | -- | |
| Nancy C Walker As Trustee | -- | -- | |
| Diallo Thierno Malal | -- | -- |
Source: Public Records
Mortgage History
| Date | Status | Borrower | Loan Amount |
|---|---|---|---|
| Previous Owner | Diallo Walker | $340,000 |
Source: Public Records
Tax History Compared to Growth
Tax History
| Year | Tax Paid | Tax Assessment Tax Assessment Total Assessment is a certain percentage of the fair market value that is determined by local assessors to be the total taxable value of land and additions on the property. | Land | Improvement |
|---|---|---|---|---|
| 2025 | $2,216 | $45,960 | $13,200 | $32,760 |
| 2024 | $2,216 | $44,040 | $13,200 | $30,840 |
| 2023 | $2,093 | $49,260 | $13,200 | $36,060 |
| 2022 | $2,001 | $53,940 | $13,200 | $40,740 |
| 2021 | $1,960 | $46,140 | $13,200 | $32,940 |
| 2020 | $974 | $41,460 | $13,200 | $28,260 |
| 2019 | $1,631 | $41,460 | $13,200 | $28,260 |
| 2018 | $1,473 | $8,686 | $2,953 | $5,733 |
| 2017 | $1,374 | $8,210 | $3,671 | $4,539 |
| 2016 | $1,242 | $7,761 | $3,602 | $4,159 |
| 2015 | $714 | $7,761 | $5,050 | $2,711 |
| 2014 | $714 | $7,663 | $5,040 | $2,623 |
Source: Public Records
Map
Nearby Homes
- 52 Bradford St
- 57 Wyona St
- 2735 Fulton St
- 107 Miller Ave
- 90 Wyona St
- 52 van Siclen Ave
- 48 van Siclen Ave
- 168 Miller Ave
- 178 Highland Blvd
- 14 van Siclen Ct
- 153 Hendrix St
- 153 Highland Blvd
- 4 Crosby Ave
- 2830 Fulton St
- 224 Highland Blvd Unit 710
- 159 Wyona St
- 87 Schenck Ave
- 174 van Siclen Ave
- 133 Sunnyside Ave
- 2825 Atlantic Ave