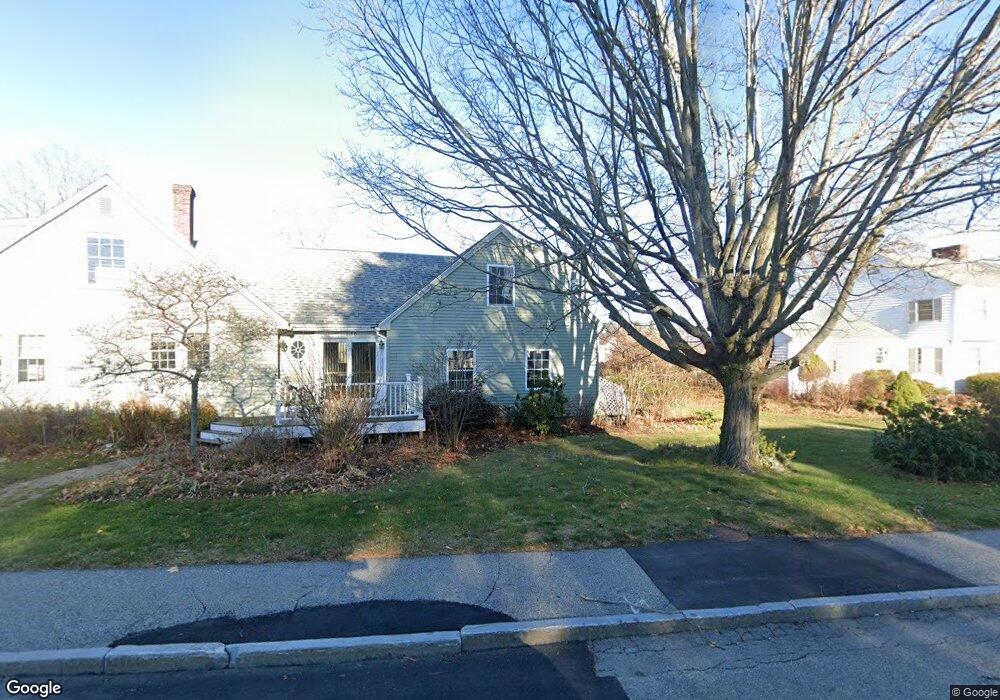
290 Alfred St Biddeford, ME 04005
Estimated Value: $430,000 - $500,000
3
Beds
2
Baths
1,852
Sq Ft
$246/Sq Ft
Est. Value
About This Home
This home is located at 290 Alfred St, Biddeford, ME 04005 and is currently estimated at $456,332, approximately $246 per square foot. 290 Alfred St is a home located in York County with nearby schools including John F Kennedy Memorial School, Biddeford Primary School, and Biddeford Intermediate School.
Ownership History
Date
Name
Owned For
Owner Type
Purchase Details
Closed on
Nov 4, 2022
Sold by
Perreault Gerald N and Perreault Kathleen
Bought by
Perreault Ft
Current Estimated Value
Purchase Details
Closed on
Jul 29, 2005
Sold by
Metayer Lucienne C Est
Bought by
Perreault Kathleen and Perreault Gerald N
Home Financials for this Owner
Home Financials are based on the most recent Mortgage that was taken out on this home.
Original Mortgage
$146,775
Interest Rate
5.67%
Mortgage Type
Purchase Money Mortgage
Create a Home Valuation Report for This Property
The Home Valuation Report is an in-depth analysis detailing your home's value as well as a comparison with similar homes in the area
Home Values in the Area
Average Home Value in this Area
Purchase History
| Date | Buyer | Sale Price | Title Company |
|---|---|---|---|
| Perreault Ft | -- | None Available | |
| Perreault Kathleen | -- | -- |
Source: Public Records
Mortgage History
| Date | Status | Borrower | Loan Amount |
|---|---|---|---|
| Previous Owner | Perreault Kathleen | $146,775 |
Source: Public Records
Tax History Compared to Growth
Tax History
| Year | Tax Paid | Tax Assessment Tax Assessment Total Assessment is a certain percentage of the fair market value that is determined by local assessors to be the total taxable value of land and additions on the property. | Land | Improvement |
|---|---|---|---|---|
| 2024 | $5,014 | $352,600 | $148,900 | $203,700 |
| 2023 | $4,585 | $349,500 | $148,900 | $200,600 |
| 2022 | $3,961 | $241,400 | $81,100 | $160,300 |
| 2021 | $3,651 | $206,300 | $67,500 | $138,800 |
| 2020 | $6,279 | $174,700 | $57,400 | $117,300 |
| 2019 | $3,491 | $174,700 | $57,400 | $117,300 |
| 2018 | $9,495 | $174,700 | $57,400 | $117,300 |
| 2017 | $3,406 | $169,700 | $57,400 | $112,300 |
| 2016 | $2,922 | $169,700 | $57,400 | $112,300 |
| 2015 | $2,993 | $169,700 | $57,400 | $112,300 |
| 2014 | $2,919 | $169,700 | $57,400 | $112,300 |
| 2013 | -- | $211,800 | $69,300 | $142,500 |
Source: Public Records
Map
Nearby Homes