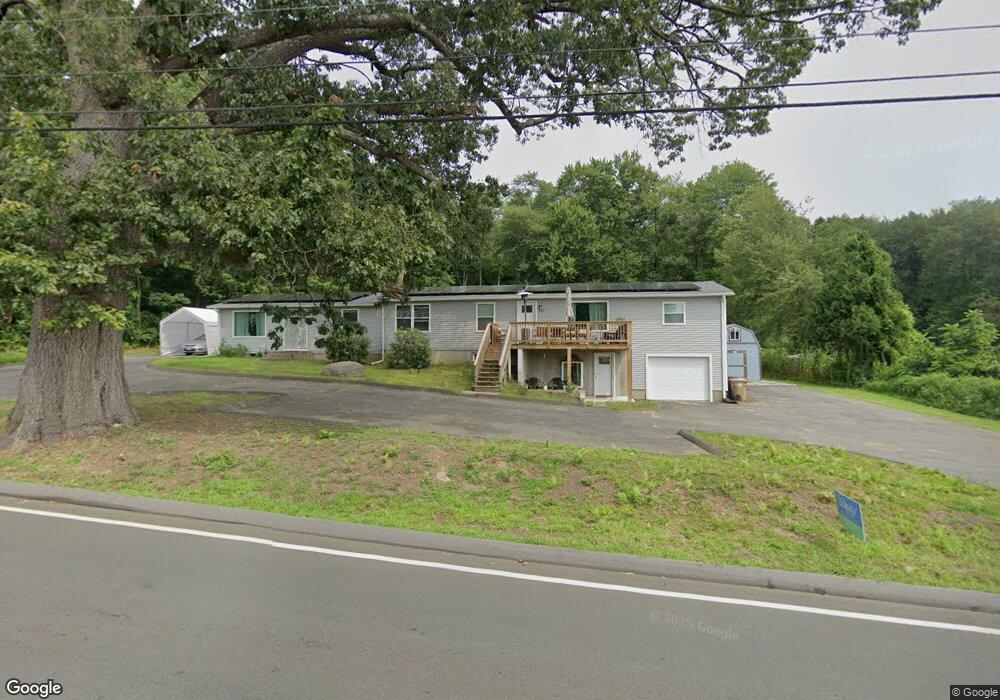
290 Cady St Unit 292 Ludlow, MA 01056
Estimated Value: $520,000 - $630,000
6
Beds
4
Baths
3,768
Sq Ft
$148/Sq Ft
Est. Value
About This Home
This home is located at 290 Cady St Unit 292, Ludlow, MA 01056 and is currently estimated at $557,290, approximately $147 per square foot. 290 Cady St Unit 292 is a home located in Hampden County with nearby schools including East Street Elementary School, Chapin Street Elementary School, and Paul R. Baird Middle School.
Ownership History
Date
Name
Owned For
Owner Type
Purchase Details
Closed on
Dec 18, 2024
Sold by
Cornerstone Hmbuying Llc
Bought by
Hill Harry D and Hill Norma
Current Estimated Value
Home Financials for this Owner
Home Financials are based on the most recent Mortgage that was taken out on this home.
Original Mortgage
$463,500
Outstanding Balance
$459,019
Interest Rate
6.79%
Mortgage Type
Purchase Money Mortgage
Estimated Equity
$98,271
Purchase Details
Closed on
Jan 23, 2024
Sold by
Bailey Michael J
Bought by
Cornerstone Hmbuying Llc
Home Financials for this Owner
Home Financials are based on the most recent Mortgage that was taken out on this home.
Original Mortgage
$360,000
Interest Rate
7.03%
Mortgage Type
Purchase Money Mortgage
Purchase Details
Closed on
Oct 6, 2009
Sold by
Moorhouse Edna T
Bought by
Bailey Michael J
Purchase Details
Closed on
Oct 3, 1989
Sold by
Moorhouse Keith B
Bought by
Creative Rlty West Ma
Home Financials for this Owner
Home Financials are based on the most recent Mortgage that was taken out on this home.
Original Mortgage
$150,000
Interest Rate
9.92%
Mortgage Type
Purchase Money Mortgage
Create a Home Valuation Report for This Property
The Home Valuation Report is an in-depth analysis detailing your home's value as well as a comparison with similar homes in the area
Home Values in the Area
Average Home Value in this Area
Purchase History
| Date | Buyer | Sale Price | Title Company |
|---|---|---|---|
| Hill Harry D | $515,000 | Misc Company | |
| Hill Harry D | $515,000 | Misc Company | |
| Hill Harry D | $515,000 | Misc Company | |
| Cornerstone Hmbuying Llc | $215,000 | None Available | |
| Cornerstone Hmbuying Llc | $215,000 | None Available | |
| Cornerstone Hmbuying Llc | $215,000 | None Available | |
| Bailey Michael J | -- | -- | |
| Bailey Michael J | -- | -- | |
| Creative Rlty West Ma | $150,000 | -- | |
| Creative Rlty West Ma | $150,000 | -- |
Source: Public Records
Mortgage History
| Date | Status | Borrower | Loan Amount |
|---|---|---|---|
| Open | Hill Harry D | $463,500 | |
| Closed | Hill Harry D | $463,500 | |
| Previous Owner | Cornerstone Hmbuying Llc | $360,000 | |
| Previous Owner | Creative Rlty West Ma | $150,000 |
Source: Public Records
Tax History Compared to Growth
Tax History
| Year | Tax Paid | Tax Assessment Tax Assessment Total Assessment is a certain percentage of the fair market value that is determined by local assessors to be the total taxable value of land and additions on the property. | Land | Improvement |
|---|---|---|---|---|
| 2025 | $5,987 | $345,100 | $97,300 | $247,800 |
| 2024 | $5,678 | $313,900 | $97,300 | $216,600 |
| 2023 | $5,777 | $296,100 | $85,400 | $210,700 |
| 2022 | $5,701 | $285,200 | $85,400 | $199,800 |
| 2021 | $5,555 | $263,500 | $85,400 | $178,100 |
| 2020 | $5,320 | $258,000 | $84,100 | $173,900 |
| 2019 | $5,125 | $258,600 | $83,300 | $175,300 |
| 2018 | $4,916 | $258,600 | $83,300 | $175,300 |
| 2017 | $4,799 | $259,000 | $80,800 | $178,200 |
| 2016 | $4,547 | $250,800 | $79,200 | $171,600 |
| 2015 | $4,312 | $249,400 | $78,400 | $171,000 |
Source: Public Records
Map
Nearby Homes