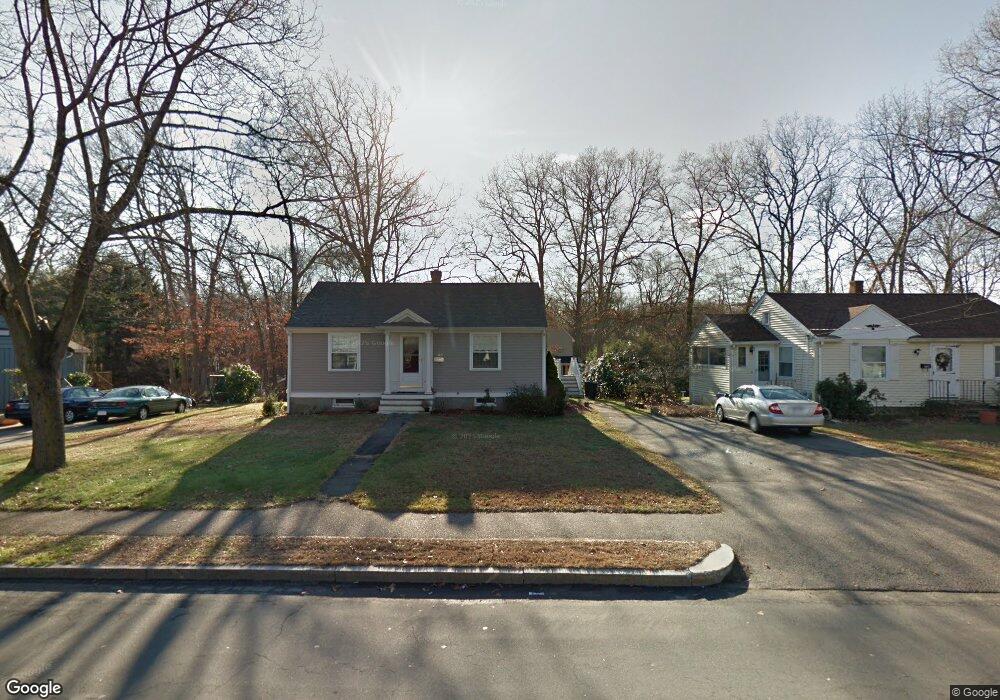
290 Common St Braintree, MA 02184
North Braintree NeighborhoodEstimated Value: $961,000 - $1,201,000
About This Home
This home is located at 290 Common St, Braintree, MA 02184 and is currently estimated at $1,074,250, approximately $302 per square foot. 290 Common St is a home located in Norfolk County with nearby schools including Braintree High School, Step Ahead Kindergarten, and Meeting House Montessori School.
Ownership History
We collect this data history from publicly available records. To have your information removed, we recommend requesting removal directly through your county’s website.
Purchase Details
Home Financials for this Owner
Home Financials are based on the most recent Mortgage that was taken out on this home.Home Values in the Area
Average Home Value in this Area
Purchase History
We collect this data history from publicly available records. To have your information removed, we recommend requesting removal directly through your county’s website.
| Date | Buyer | Sale Price | Title Company |
|---|---|---|---|
| $197,000 | -- | ||
| $197,000 | -- |
Mortgage History
We collect this data history from publicly available records. To have your information removed, we recommend requesting removal directly through your county’s website.
| Date | Status | Borrower | Loan Amount |
|---|---|---|---|
| Open | $140,000 | ||
| Closed | $18,000 |
Tax History
We collect this data history from publicly available records. To have your information removed, we recommend requesting removal directly through your county’s website.
| Year | Tax Paid | Tax Assessment Tax Assessment Total Assessment is a certain percentage of the fair market value that is determined by local assessors to be the total taxable value of land and additions on the property. | Land | Improvement |
|---|---|---|---|---|
| 2025 | $8,721 | $873,800 | $370,400 | $503,400 |
| 2024 | $8,109 | $855,400 | $351,300 | $504,100 |
| 2023 | $7,719 | $790,900 | $313,800 | $477,100 |
| 2022 | $7,745 | $778,400 | $301,300 | $477,100 |
| 2021 | $7,102 | $713,800 | $263,800 | $450,000 |
| 2020 | $7,038 | $713,800 | $263,800 | $450,000 |
| 2019 | $6,759 | $669,900 | $251,300 | $418,600 |
| 2018 | $6,620 | $628,100 | $226,300 | $401,800 |
| 2017 | $6,297 | $586,300 | $201,300 | $385,000 |
| 2016 | $6,052 | $551,200 | $188,800 | $362,400 |
| 2015 | $5,864 | $529,700 | $181,300 | $348,400 |
| 2014 | $5,643 | $494,100 | $163,800 | $330,300 |
Map
- 241 Walnut St
- 18 Howie Rd
- 78 Windemere Cir
- 47 Judson St
- 20 Blossom Rd
- 49 Cochato Rd
- 78 Blossom Rd
- 31 Brierwood Rd
- 9 Independence Ave Unit 205
- 11 Oak Grove Terrace Unit 303
- 11 Oak Grove Terrace Unit 402
- 21 Totman St Unit 205
- 21 Totman St Unit 210
- 21 Totman St Unit 302
- 21 Totman St Unit 403
- 21 Totman St Unit 301
- 30 Church St Unit 12
- 98 West St
- 491 Washington St Unit 1
- 199 Hawthorn Rd
Ask me questions while you tour the home.