290 Crescent St Brooklyn, NY 11208
Cypress Hills NeighborhoodEstimated Value: $891,810 - $979,000
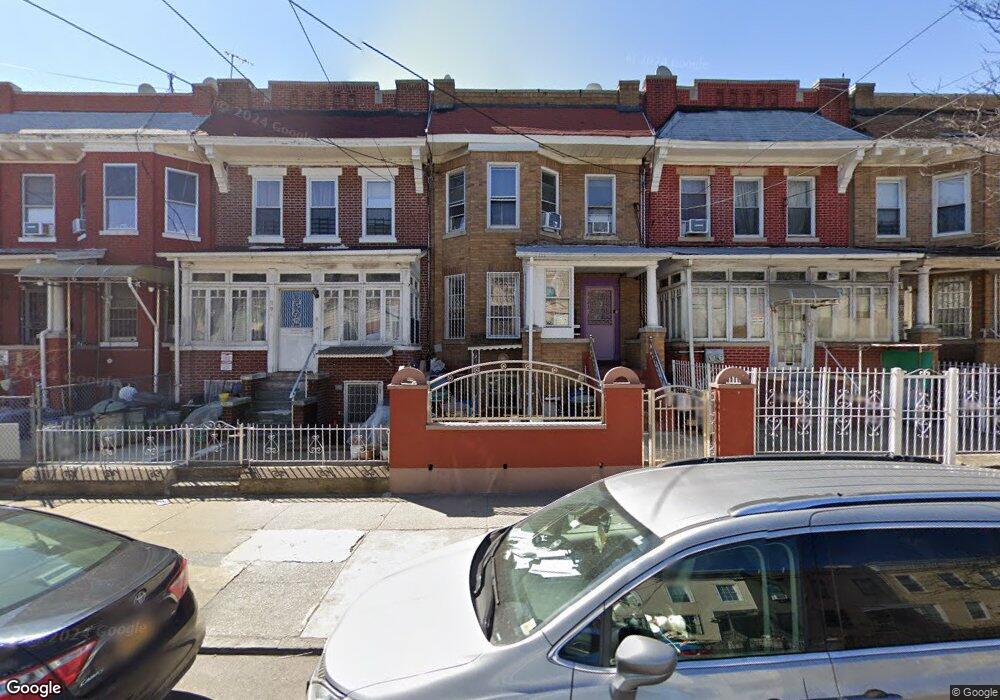
About This Home
This home is located at 290 Crescent St, Brooklyn, NY 11208 and is currently estimated at $941,453, approximately $383 per square foot. 290 Crescent St is a home located in Kings County with nearby schools including P.S. 65, Is 171 Abraham Lincoln, and Cypress Hills Ascend Charter Lower School.
Ownership History
We collect this data history from publicly available records. To have your information removed, we recommend requesting removal directly through your county’s website.
Purchase Details
Purchase Details
Home Financials for this Owner
Home Financials are based on the most recent Mortgage that was taken out on this home.Home Values in the Area
Average Home Value in this Area
Purchase History
We collect this data history from publicly available records. To have your information removed, we recommend requesting removal directly through your county’s website.
| Date | Buyer | Sale Price | Title Company |
|---|---|---|---|
| -- | -- | ||
| $475,000 | -- |
Mortgage History
We collect this data history from publicly available records. To have your information removed, we recommend requesting removal directly through your county’s website.
| Date | Status | Borrower | Loan Amount |
|---|---|---|---|
| Previous Owner | $170,000 |
Tax History
We collect this data history from publicly available records. To have your information removed, we recommend requesting removal directly through your county’s website.
| Year | Tax Paid | Tax Assessment Tax Assessment Total Assessment is a certain percentage of the fair market value that is determined by local assessors to be the total taxable value of land and additions on the property. | Land | Improvement |
|---|---|---|---|---|
| 2026 | $2,796 | $66,540 | $16,500 | $50,040 |
| 2025 | $2,648 | $69,300 | $16,500 | $52,800 |
| 2024 | $2,648 | $58,260 | $16,500 | $41,760 |
| 2023 | $2,595 | $63,000 | $16,500 | $46,500 |
| 2022 | $2,376 | $51,540 | $16,500 | $35,040 |
| 2021 | $2,546 | $43,860 | $16,500 | $27,360 |
| 2020 | $1,869 | $42,360 | $16,500 | $25,860 |
| 2019 | $2,302 | $40,440 | $16,500 | $23,940 |
| 2018 | $2,063 | $26,707 | $13,233 | $13,474 |
| 2017 | $2,620 | $26,707 | $11,316 | $15,391 |
| 2016 | $4,764 | $25,380 | $12,576 | $12,804 |
| 2015 | $3,039 | $25,003 | $15,582 | $9,421 |
| 2014 | $3,039 | $23,589 | $15,293 | $8,296 |
Map
- 266 Hemlock St
- 243 Crescent St
- 294 Autumn Ave
- 3412 Atlantic Ave
- 61 Glen St
- 285 Lincoln Ave
- 217 Hemlock St
- 312 Nichols Ave
- 331 Lincoln Ave
- 272 Nichols Ave
- 367 Lincoln Ave
- 213 Autumn Ave
- 3440 Fulton St
- 169 Euclid Ave
- 81 Mckinley Ave
- 3242 Fulton St
- 350 Grant Ave
- 3235 Fulton St
- 182 Lincoln Ave
- 397 Crescent St
- 283 Crescent St
- 279 Crescent St
- 285 Crescent St
- 277 Crescent St
- 287 Crescent St
- 275 Crescent St
- 289 Crescent St
- 273 Crescent St
- 293 Crescent St
- 271 Crescent St
- 271 Crescent St Unit 2 Fl.
- 295 Crescent St
- 298 Hemlock St
- 300 Hemlock St
- 294 Hemlock St
- 294 Hemlock St Unit 1
- 302 Hemlock St
- 302 Hemlock St Unit 1 & 2
- 292 Hemlock St
- 269 Crescent St
Ask me questions while you tour the home.