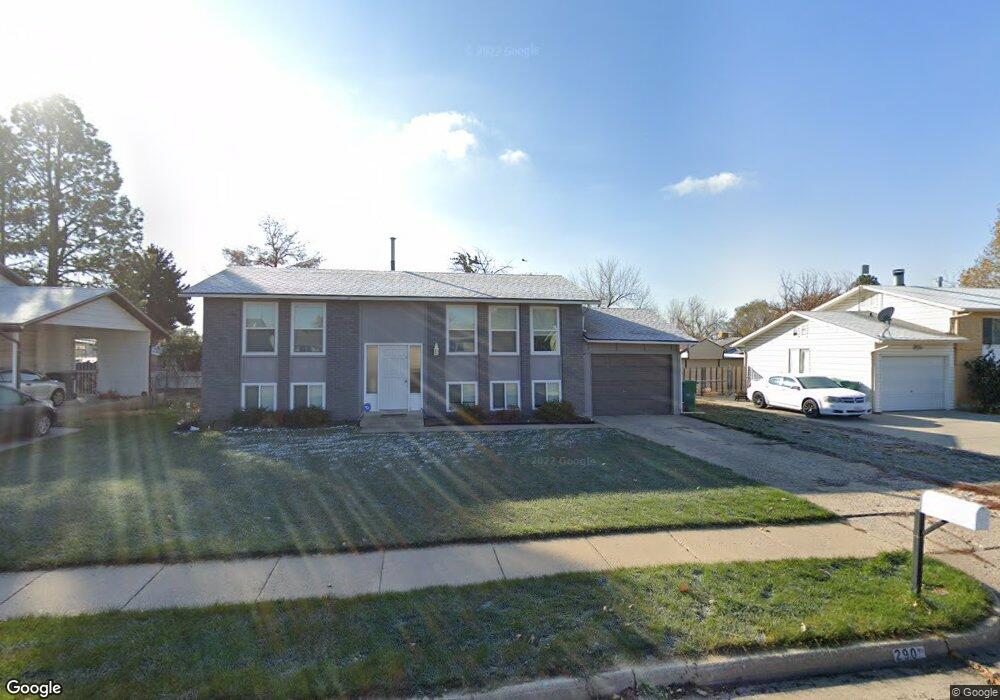
290 E 1250 N Layton, UT 84041
Estimated Value: $428,000 - $450,000
5
Beds
2
Baths
1,956
Sq Ft
$225/Sq Ft
Est. Value
About This Home
This home is located at 290 E 1250 N, Layton, UT 84041 and is currently estimated at $440,475, approximately $225 per square foot. 290 E 1250 N is a home located in Davis County with nearby schools including King Elementary School, Central Davis Junior High School, and Northridge High School.
Ownership History
Date
Name
Owned For
Owner Type
Purchase Details
Closed on
Feb 22, 2018
Sold by
Dunlop Tessa L
Bought by
Callister Chabre
Current Estimated Value
Home Financials for this Owner
Home Financials are based on the most recent Mortgage that was taken out on this home.
Original Mortgage
$217,280
Outstanding Balance
$184,750
Interest Rate
4.15%
Mortgage Type
New Conventional
Estimated Equity
$255,725
Purchase Details
Closed on
Aug 22, 2013
Sold by
Hudnall Ronald D and Hudnall Ruby
Bought by
My Investment
Purchase Details
Closed on
Apr 14, 2006
Sold by
Hudnall Ronald D
Bought by
Hudnall Ronald D and Hudnall Ruby D
Home Financials for this Owner
Home Financials are based on the most recent Mortgage that was taken out on this home.
Original Mortgage
$101,250
Interest Rate
6.35%
Mortgage Type
Fannie Mae Freddie Mac
Create a Home Valuation Report for This Property
The Home Valuation Report is an in-depth analysis detailing your home's value as well as a comparison with similar homes in the area
Home Values in the Area
Average Home Value in this Area
Purchase History
| Date | Buyer | Sale Price | Title Company |
|---|---|---|---|
| Callister Chabre | -- | First American Title | |
| My Investment | $125,807 | None Available | |
| Hudnall Ronald D | -- | First American Title |
Source: Public Records
Mortgage History
| Date | Status | Borrower | Loan Amount |
|---|---|---|---|
| Open | Callister Chabre | $217,280 | |
| Previous Owner | Hudnall Ronald D | $101,250 |
Source: Public Records
Tax History
| Year | Tax Paid | Tax Assessment Tax Assessment Total Assessment is a certain percentage of the fair market value that is determined by local assessors to be the total taxable value of land and additions on the property. | Land | Improvement |
|---|---|---|---|---|
| 2025 | $2,122 | $222,750 | $99,118 | $123,632 |
| 2024 | $2,065 | $218,350 | $115,664 | $102,686 |
| 2023 | $2,044 | $381,000 | $139,109 | $241,891 |
| 2022 | $2,119 | $214,500 | $73,071 | $141,429 |
| 2021 | $1,994 | $301,000 | $101,243 | $199,757 |
| 2020 | $1,802 | $261,000 | $85,715 | $175,285 |
| 2019 | $1,784 | $253,000 | $81,892 | $171,108 |
| 2018 | $1,615 | $230,000 | $81,892 | $148,108 |
| 2016 | $1,322 | $97,075 | $25,821 | $71,254 |
| 2015 | $1,247 | $86,955 | $25,821 | $61,134 |
| 2014 | $1,082 | $77,166 | $25,821 | $51,345 |
| 2013 | -- | $77,996 | $18,612 | $59,384 |
Source: Public Records
Map
Nearby Homes
Your Personal Tour Guide
Ask me questions while you tour the home.