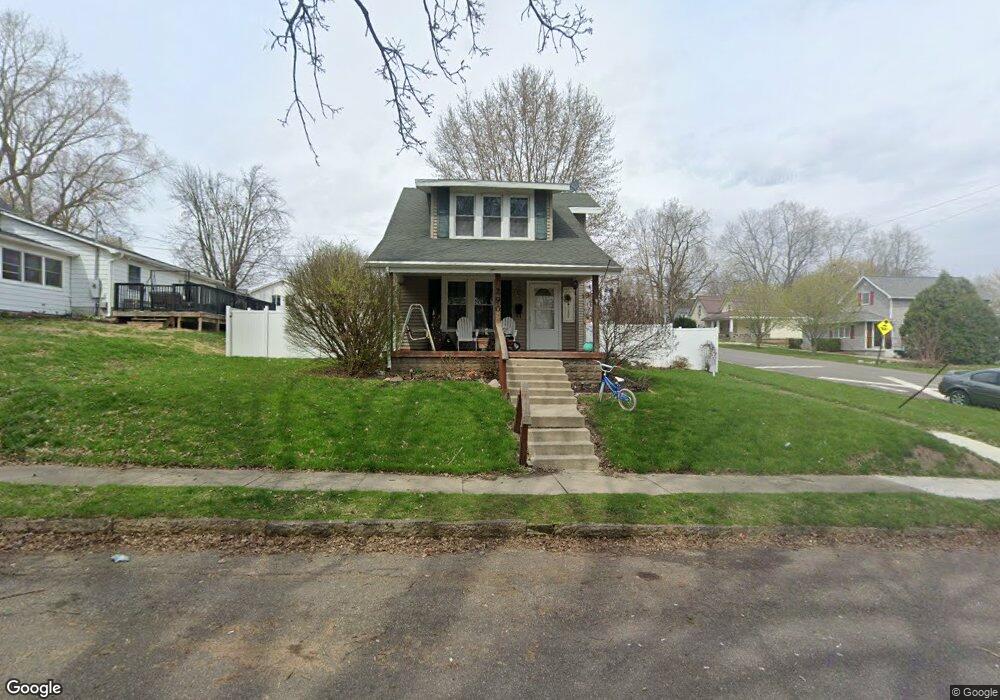
290 E Sinclair St Wabash, IN 46992
Estimated Value: $109,000 - $193,000
3
Beds
2
Baths
1,208
Sq Ft
$118/Sq Ft
Est. Value
About This Home
This home is located at 290 E Sinclair St, Wabash, IN 46992 and is currently estimated at $142,107, approximately $117 per square foot. 290 E Sinclair St is a home located in Wabash County with nearby schools including O.J. Neighbours Elementary School, W C Mills Elementary School, and Wabash Middle School.
Ownership History
Date
Name
Owned For
Owner Type
Purchase Details
Closed on
Oct 10, 2022
Sold by
Gill Sabrina S
Bought by
Gill Sabrina Sue
Current Estimated Value
Home Financials for this Owner
Home Financials are based on the most recent Mortgage that was taken out on this home.
Original Mortgage
$105,820
Outstanding Balance
$101,840
Interest Rate
6.88%
Mortgage Type
FHA
Estimated Equity
$40,267
Purchase Details
Closed on
Aug 14, 2018
Sold by
Engle Craig A
Bought by
Gill Sabrna S
Purchase Details
Closed on
May 15, 2018
Sold by
Breaton Jonathan T
Bought by
Engle Craig A
Purchase Details
Closed on
Mar 17, 2006
Sold by
Frances Slocum Bank
Bought by
Engle Craig A and Engle Shari K
Home Financials for this Owner
Home Financials are based on the most recent Mortgage that was taken out on this home.
Original Mortgage
$38,000
Interest Rate
6.33%
Mortgage Type
Future Advance Clause Open End Mortgage
Create a Home Valuation Report for This Property
The Home Valuation Report is an in-depth analysis detailing your home's value as well as a comparison with similar homes in the area
Home Values in the Area
Average Home Value in this Area
Purchase History
| Date | Buyer | Sale Price | Title Company |
|---|---|---|---|
| Gill Sabrina Sue | -- | None Listed On Document | |
| Gill Sabrna S | $81,000 | Trademark Title Inc | |
| Engle Craig A | -- | None Available | |
| Engle Craig A | -- | -- |
Source: Public Records
Mortgage History
| Date | Status | Borrower | Loan Amount |
|---|---|---|---|
| Open | Gill Sabrina Sue | $105,820 | |
| Previous Owner | Engle Craig A | $38,000 |
Source: Public Records
Tax History
| Year | Tax Paid | Tax Assessment Tax Assessment Total Assessment is a certain percentage of the fair market value that is determined by local assessors to be the total taxable value of land and additions on the property. | Land | Improvement |
|---|---|---|---|---|
| 2025 | $849 | $105,300 | $9,900 | $95,400 |
| 2024 | $849 | $92,100 | $9,900 | $82,200 |
| 2023 | $702 | $87,200 | $9,900 | $77,300 |
| 2022 | $805 | $81,400 | $9,900 | $71,500 |
| 2021 | $671 | $75,800 | $9,900 | $65,900 |
| 2020 | $617 | $69,800 | $9,900 | $59,900 |
| 2019 | $509 | $66,600 | $9,900 | $56,700 |
| 2018 | $507 | $66,100 | $9,900 | $56,200 |
| 2017 | $497 | $60,800 | $9,900 | $50,900 |
| 2016 | $324 | $59,800 | $9,900 | $49,900 |
| 2014 | $270 | $60,200 | $9,900 | $50,300 |
| 2013 | $224 | $59,100 | $9,900 | $49,200 |
Source: Public Records
Map
Nearby Homes
- 276 E Sinclair St
- 258 E Sinclair St
- 105 N Spring St
- 115 N Spring St
- 135 N Spring St
- 242 E Sinclair St
- 167 N Spring St
- 291 E Maple St
- 273 E Maple St
- 222 E Sinclair St
- 193 N Spring St
- 259 E Maple St
- 245 E Maple St
- 31 N Spring St
- 231 E Maple St
- 325 E Maple St
- 45 N Spring St
- 109 N Allen St
- 125 N Allen St
- 286 E Maple St
Your Personal Tour Guide
Ask me questions while you tour the home.