Estimated Value: $806,000 - $1,036,470
2
Beds
3
Baths
2,489
Sq Ft
$361/Sq Ft
Est. Value
About This Home
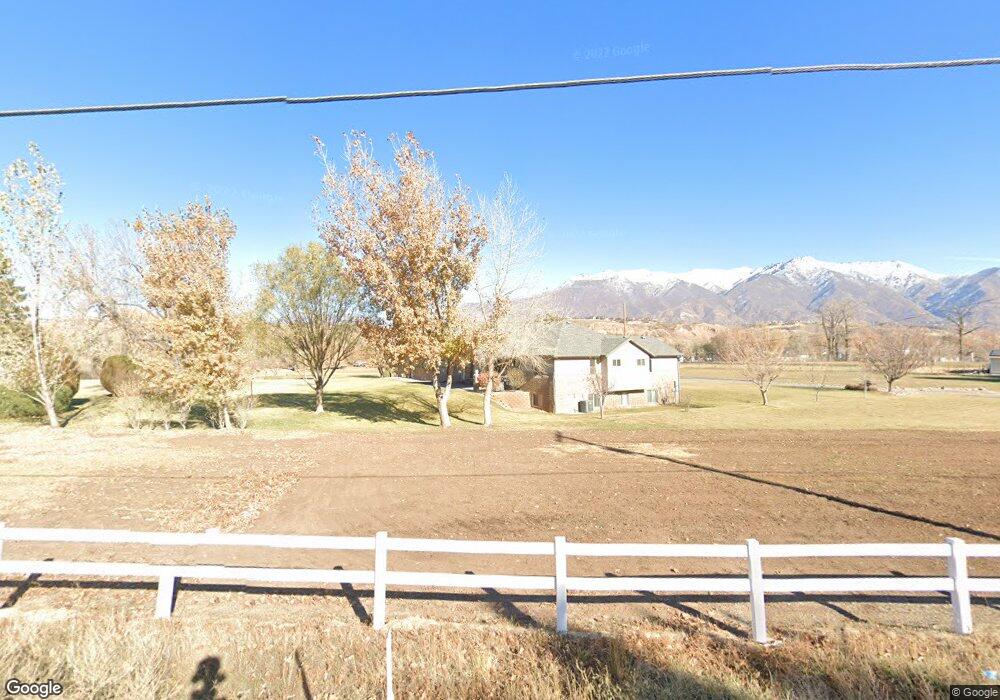
This home is located at 290 E South Weber Dr, Ogden, UT 84405 and is currently estimated at $898,618, approximately $361 per square foot. 290 E South Weber Dr is a home located in Davis County with nearby schools including South Weber Elementary School, Sunset Junior High School, and Northridge High School.
Ownership History
Date
Name
Owned For
Owner Type
Purchase Details
Closed on
Feb 28, 2024
Sold by
Laub David R and Laub Kristine K
Bought by
David & Kristine Laub Family Trust and Laub
Current Estimated Value
Purchase Details
Closed on
Jan 26, 2024
Sold by
Laub David R and Laub Kristine K
Bought by
David R & Kristine Laub Family Trust
Purchase Details
Closed on
Jun 10, 2008
Sold by
Laub Benjamin T
Bought by
Laub David R and Laub Kristine K
Home Financials for this Owner
Home Financials are based on the most recent Mortgage that was taken out on this home.
Original Mortgage
$400,000
Interest Rate
6.05%
Mortgage Type
Purchase Money Mortgage
Purchase Details
Closed on
Dec 12, 2005
Sold by
K B E H Ltd
Bought by
Laub Benjamin T
Home Financials for this Owner
Home Financials are based on the most recent Mortgage that was taken out on this home.
Original Mortgage
$127,000
Interest Rate
6.14%
Mortgage Type
Fannie Mae Freddie Mac
Create a Home Valuation Report for This Property
The Home Valuation Report is an in-depth analysis detailing your home's value as well as a comparison with similar homes in the area
Purchase History
| Date | Buyer | Sale Price | Title Company |
|---|---|---|---|
| David & Kristine Laub Family Trust | -- | None Listed On Document | |
| David R & Kristine Laub Family Trust | -- | None Listed On Document | |
| Laub David R | -- | Equity Title Ins Agency Inc | |
| Laub Benjamin T | -- | Equity Title Ins Agency Inc |
Source: Public Records
Mortgage History
| Date | Status | Borrower | Loan Amount |
|---|---|---|---|
| Previous Owner | Laub David R | $400,000 | |
| Previous Owner | Laub Benjamin T | $127,000 |
Source: Public Records
Tax History
| Year | Tax Paid | Tax Assessment Tax Assessment Total Assessment is a certain percentage of the fair market value that is determined by local assessors to be the total taxable value of land and additions on the property. | Land | Improvement |
|---|---|---|---|---|
| 2025 | $5,512 | $549,139 | $283,186 | $265,953 |
| 2024 | $5,169 | $465,850 | $206,646 | $259,204 |
| 2023 | $4,541 | $458,150 | $167,197 | $290,952 |
| 2022 | $4,641 | $852,000 | $325,476 | $526,524 |
| 2021 | $3,996 | $616,000 | $258,046 | $357,954 |
| 2020 | $3,676 | $552,000 | $240,421 | $311,579 |
| 2019 | $3,622 | $531,000 | $203,589 | $327,411 |
| 2018 | $3,212 | $495,000 | $185,437 | $309,563 |
| 2016 | $3,010 | $242,330 | $81,694 | $160,636 |
| 2015 | $2,916 | $222,090 | $81,694 | $140,396 |
| 2014 | $4,281 | $331,942 | $90,997 | $240,945 |
| 2013 | -- | $289,025 | $48,080 | $240,945 |
Source: Public Records
Map
Nearby Homes
- 185 E South Weber Dr
- 6558 S Aspen Ln
- 6525 S 475 E
- 582 E Petersen Pkwy
- 6455 Raymond Dr
- 6402 Raymond Dr
- 52 W Glen Way
- 52 W Glen Way Unit 114
- 70 W Glen Way Unit 112
- 70 W Glen Way
- 79 W Glen Way Unit 101
- 79 W Glen Way
- 6399 S Ray Dr
- 6399 S Ray Dr Unit 102
- 93 W Glen Way
- 6387 S Ray Dr
- 6387 S Ray Dr Unit 103
- 6368 S Ray Dr
- 6368 S Ray Dr Unit 110
- 6379 S Ray Dr
- 296 E South Weber Dr
- 300 E South Weber Dr
- 248 E South Weber Dr
- 263 E South Weber Dr
- 342 E 6775 S
- 331 E 6725 S
- 351 E 6775 S
- 343 E 6725 S Unit 108
- 310 E South Weber Dr
- 328 E 6725 S
- 6817 S 375 E
- 353 E 6725 S
- 369 E 6775 S Unit 205
- 366 E 6775 S Unit 201
- 375 E 6650 S
- 344 E 6725 S
- 365 E 6725 S Unit 110
- 6735 S 375 E Unit 110
- 356 E South Weber Dr
- 356 E 6725 S
Your Personal Tour Guide
Ask me questions while you tour the home.