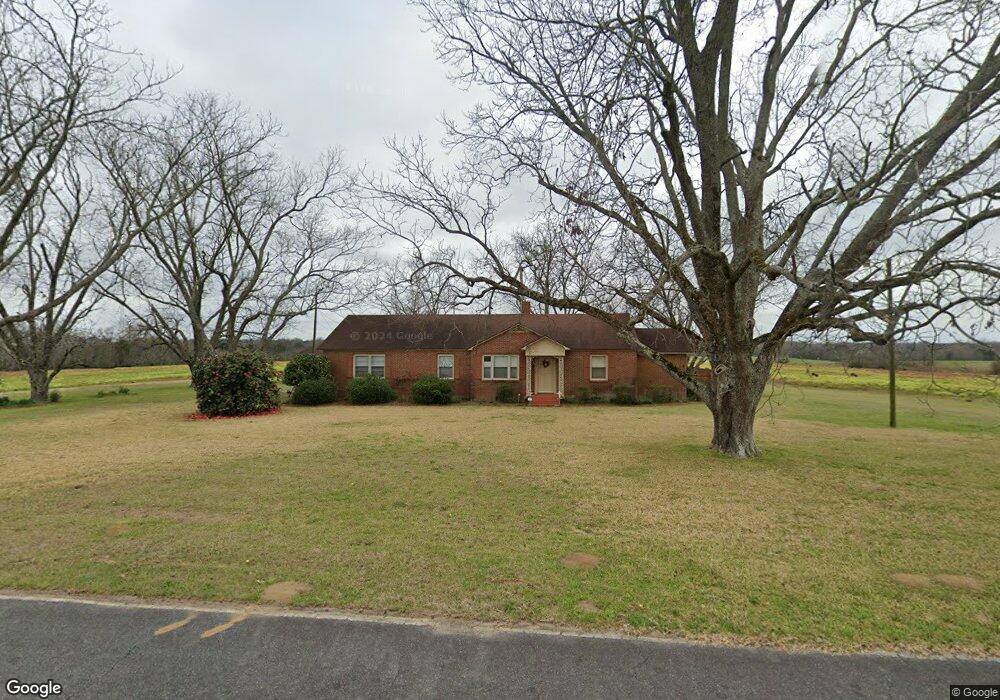
290 Floyd Nesmith Rd Cochran, GA 31014
Estimated Value: $251,000 - $496,657
3
Beds
2
Baths
1,708
Sq Ft
$220/Sq Ft
Est. Value
About This Home
This home is located at 290 Floyd Nesmith Rd, Cochran, GA 31014 and is currently estimated at $376,552, approximately $220 per square foot. 290 Floyd Nesmith Rd is a home located in Bleckley County with nearby schools including Bleckley County Primary School, Bleckley County Elementary School, and Bleckley Middle School.
Ownership History
Date
Name
Owned For
Owner Type
Purchase Details
Closed on
May 5, 2022
Sold by
Nesmith Jewell L
Bought by
Nesmith Donna J
Current Estimated Value
Purchase Details
Closed on
Feb 6, 1995
Sold by
Nesmith Gerald W
Bought by
Nesmith Gerald W
Purchase Details
Closed on
Nov 27, 1985
Sold by
Nesmith Gerald W
Bought by
Nesmith Gerald W
Purchase Details
Closed on
May 30, 1974
Bought by
Nesmith Gerald W
Create a Home Valuation Report for This Property
The Home Valuation Report is an in-depth analysis detailing your home's value as well as a comparison with similar homes in the area
Home Values in the Area
Average Home Value in this Area
Purchase History
| Date | Buyer | Sale Price | Title Company |
|---|---|---|---|
| Nesmith Donna J | -- | -- | |
| Nesmith Gerald W | -- | -- | |
| Nesmith Gerald W | -- | -- | |
| Nesmith Gerald W | -- | -- |
Source: Public Records
Tax History
| Year | Tax Paid | Tax Assessment Tax Assessment Total Assessment is a certain percentage of the fair market value that is determined by local assessors to be the total taxable value of land and additions on the property. | Land | Improvement |
|---|---|---|---|---|
| 2025 | $3,470 | $130,000 | $69,880 | $60,120 |
| 2024 | $3,478 | $130,000 | $69,880 | $60,120 |
| 2023 | $2,036 | $130,000 | $69,880 | $60,120 |
| 2022 | $1,694 | $122,800 | $69,880 | $52,920 |
| 2021 | $1,415 | $109,400 | $69,680 | $39,720 |
| 2020 | $1,402 | $109,400 | $69,680 | $39,720 |
| 2019 | $1,186 | $92,325 | $63,241 | $29,084 |
| 2018 | $2,716 | $92,325 | $63,241 | $29,084 |
| 2017 | $1,172 | $92,325 | $63,241 | $29,084 |
| 2016 | $1,162 | $92,324 | $63,241 | $29,084 |
| 2015 | -- | $92,324 | $63,241 | $29,084 |
| 2014 | -- | $92,324 | $63,241 | $29,084 |
| 2013 | -- | $92,324 | $63,240 | $87,932 |
Source: Public Records
Map
Nearby Homes
- 172 Old Eastman Rd
- 176 Pineland Estates Rd
- 0 Rock Hill Rd
- 0 Old Empire Rd Unit 260408
- 139 and 137 Ga Hwy 257
- 166 Pebble Hills Rd
- 205 Smith Sapp Rd
- 471 Kirkpatrick Rd
- 0 Jordan Place Unit 260250
- 131 Redwood Dr
- 288 Frank Cook Rd
- 319 Country Club Rd
- LOT 46 Woodland Trail Rd
- LOT 47 Woodland Trail Rd
- LOT 24 Woodland Trail Rd
- 0 Woodland Trail Rd Unit 12994880
- 0 Wood Oak Cir Unit 233873
- 0 Wood Oak Cir Unit 9278951
- 150 Wood Oak Cir
- 0 Mac Thompson Rd Unit 260249
- 318 Floyd Nesmith Rd
- 289 Floyd Nesmith Rd
- 330 Floyd Nesmith Rd
- 246 Floyd Nesmith Rd
- 221 Joe Legg Rd
- 208 Joe Legg Rd
- 331 Floyd Nesmith Rd
- 255 Floyd Nesmith Rd
- 315 Floyd Nesmith Rd
- 372 Floyd Nesmith Rd
- 202 Floyd Nesmith Rd
- 343 Floyd Nesmith Rd
- 418 Floyd Nesmith Rd
- 219 Floyd Nesmith Rd
- 326 Steve Arnold Rd
- 156 Conrad Sanders Rd
- 278 Joe Legg Rd
- 308 Steve Arnold Rd
- 149 Conrad Sanders Rd
- 205 Floyd Nesmith Rd
Your Personal Tour Guide
Ask me questions while you tour the home.