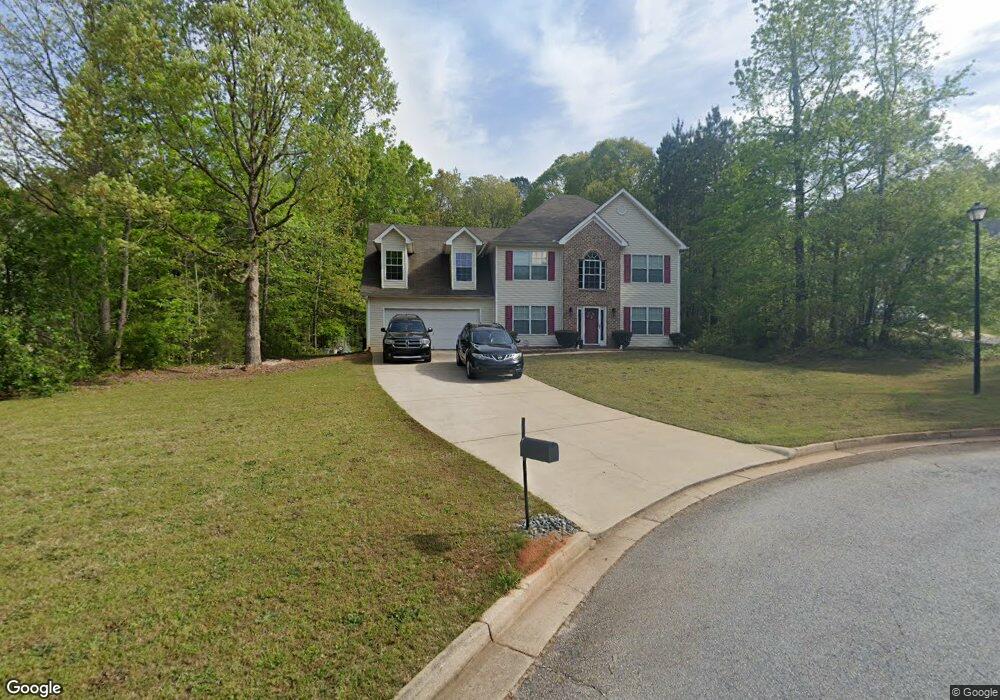
290 Highgrove Dr Unit 3 Covington, GA 30016
Estimated Value: $293,000 - $334,000
--
Bed
2
Baths
2,130
Sq Ft
$145/Sq Ft
Est. Value
About This Home
This home is located at 290 Highgrove Dr Unit 3, Covington, GA 30016 and is currently estimated at $308,311, approximately $144 per square foot. 290 Highgrove Dr Unit 3 is a home located in Newton County with nearby schools including Livingston Elementary School, Liberty Middle School, and Alcovy High School.
Ownership History
Date
Name
Owned For
Owner Type
Purchase Details
Closed on
Jun 26, 2007
Sold by
Hsbc Mtg Svcs Inc
Bought by
King Alonzo and Snead Shomika
Current Estimated Value
Home Financials for this Owner
Home Financials are based on the most recent Mortgage that was taken out on this home.
Original Mortgage
$148,900
Outstanding Balance
$91,898
Interest Rate
6.35%
Mortgage Type
New Conventional
Estimated Equity
$216,413
Purchase Details
Closed on
Jan 2, 2007
Sold by
Samuels Chasreen R
Bought by
Hsbc Mtg Svcs Inc
Purchase Details
Closed on
Dec 13, 2005
Sold by
Berkshire Hms Llc
Bought by
Samuels Chasreen R
Home Financials for this Owner
Home Financials are based on the most recent Mortgage that was taken out on this home.
Original Mortgage
$147,000
Interest Rate
6.75%
Mortgage Type
New Conventional
Create a Home Valuation Report for This Property
The Home Valuation Report is an in-depth analysis detailing your home's value as well as a comparison with similar homes in the area
Home Values in the Area
Average Home Value in this Area
Purchase History
| Date | Buyer | Sale Price | Title Company |
|---|---|---|---|
| King Alonzo | $148,900 | -- | |
| Hsbc Mtg Svcs Inc | $94,357 | -- | |
| Samuels Chasreen R | $147,000 | -- |
Source: Public Records
Mortgage History
| Date | Status | Borrower | Loan Amount |
|---|---|---|---|
| Open | King Alonzo | $148,900 | |
| Previous Owner | Samuels Chasreen R | $147,000 |
Source: Public Records
Tax History Compared to Growth
Tax History
| Year | Tax Paid | Tax Assessment Tax Assessment Total Assessment is a certain percentage of the fair market value that is determined by local assessors to be the total taxable value of land and additions on the property. | Land | Improvement |
|---|---|---|---|---|
| 2024 | $2,825 | $112,920 | $14,800 | $98,120 |
| 2023 | $2,746 | $102,800 | $8,800 | $94,000 |
| 2022 | $2,125 | $79,920 | $8,800 | $71,120 |
| 2021 | $2,312 | $78,080 | $9,600 | $68,480 |
| 2020 | $2,230 | $68,520 | $7,200 | $61,320 |
| 2019 | $1,852 | $56,440 | $7,200 | $49,240 |
| 2018 | $1,793 | $54,400 | $7,200 | $47,200 |
| 2017 | $1,696 | $51,560 | $7,200 | $44,360 |
| 2016 | $1,453 | $44,480 | $5,600 | $38,880 |
| 2015 | $1,233 | $38,080 | $4,000 | $34,080 |
| 2014 | $1,230 | $38,080 | $0 | $0 |
Source: Public Records
Map
Nearby Homes
- 300 Highgrove Dr Unit 3
- 280 Highgrove Dr
- 310 Highgrove Dr Unit 3
- 260 Highgrove Dr
- 255 Highgrove Dr
- 320 Highgrove Dr Unit 3
- 250 Highgrove Dr
- 315 Highgrove Dr
- 10 Pembroke Place
- 240 Highgrove Dr
- 325 Highgrove Dr Unit 3
- 510 Roseberry Rd
- 486 Rosebery Rd
- 65 Oakmont Ln
- 55 Oakmont Ln Unit 3
- 20 Pembroke Place
- 330 Highgrove Dr
- 0 Pembroke Place Unit 7219284
- 0 Pembroke Place
- 30 Pembroke Place