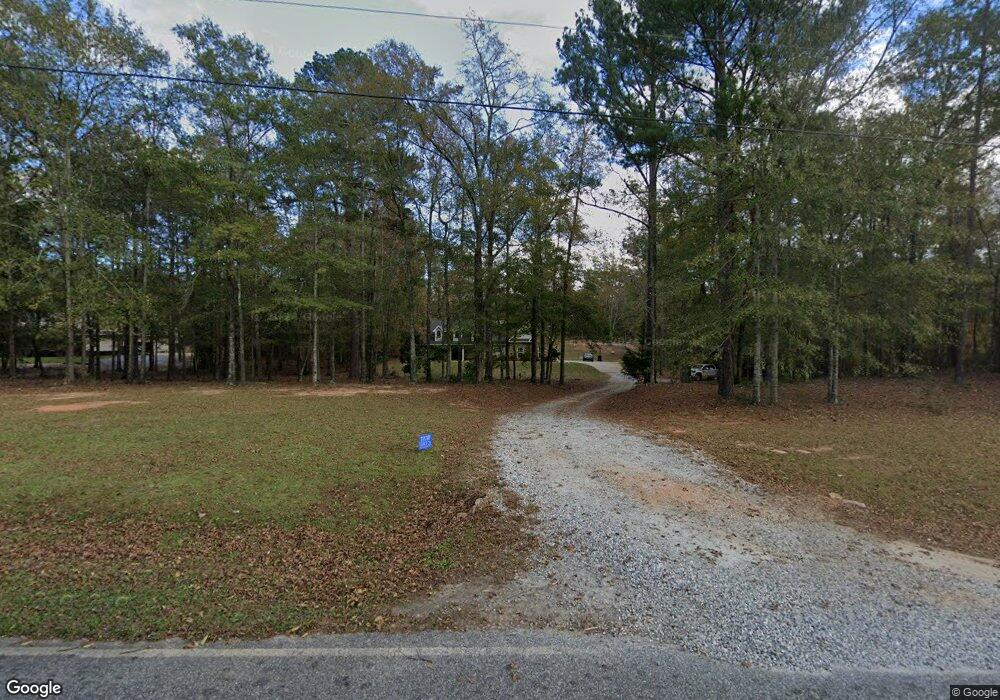
290 Hines Gap Rd Hamilton, GA 31811
Estimated Value: $339,000 - $476,000
3
Beds
2
Baths
2,244
Sq Ft
$179/Sq Ft
Est. Value
About This Home
This home is located at 290 Hines Gap Rd, Hamilton, GA 31811 and is currently estimated at $402,426, approximately $179 per square foot. 290 Hines Gap Rd is a home with nearby schools including Park Elementary School, Harris County Carver Middle School, and Creekside School.
Ownership History
Date
Name
Owned For
Owner Type
Purchase Details
Closed on
Jun 28, 2021
Sold by
Parker Jacob Bowen
Bought by
Parker Liv Tr
Current Estimated Value
Purchase Details
Closed on
Oct 17, 2007
Sold by
Martin Michael T
Bought by
Parker Jacob Bowen and Mcdaniel Tracie L
Purchase Details
Closed on
Jan 23, 2006
Sold by
Ford Faye C
Bought by
Martin Michael T and Gannon Erica J
Home Financials for this Owner
Home Financials are based on the most recent Mortgage that was taken out on this home.
Original Mortgage
$38,000
Interest Rate
6.21%
Mortgage Type
New Conventional
Purchase Details
Closed on
Jul 14, 2004
Sold by
Key Daniel C and Key Lynn F
Bought by
Ford Faye C
Purchase Details
Closed on
Dec 13, 2001
Bought by
Key Daniel C and Key Lynn F
Create a Home Valuation Report for This Property
The Home Valuation Report is an in-depth analysis detailing your home's value as well as a comparison with similar homes in the area
Purchase History
| Date | Buyer | Sale Price | Title Company |
|---|---|---|---|
| Parker Liv Tr | -- | -- | |
| Parker Jacob Bowen | $45,000 | -- | |
| Martin Michael T | $40,000 | -- | |
| Ford Faye C | -- | -- | |
| Key Daniel C | $32,800 | -- |
Source: Public Records
Mortgage History
| Date | Status | Borrower | Loan Amount |
|---|---|---|---|
| Previous Owner | Martin Michael T | $38,000 | |
| Closed | Parker Jacob Bowen | $0 |
Source: Public Records
Tax History
| Year | Tax Paid | Tax Assessment Tax Assessment Total Assessment is a certain percentage of the fair market value that is determined by local assessors to be the total taxable value of land and additions on the property. | Land | Improvement |
|---|---|---|---|---|
| 2025 | $3,410 | $113,887 | $16,310 | $97,577 |
| 2024 | $2,897 | $103,193 | $14,512 | $88,681 |
| 2023 | $2,893 | $103,043 | $14,512 | $88,531 |
| 2022 | $2,893 | $103,043 | $14,512 | $88,531 |
| 2021 | $2,786 | $95,417 | $14,512 | $80,905 |
| 2020 | $2,786 | $95,417 | $14,512 | $80,905 |
| 2019 | $2,691 | $95,417 | $14,512 | $80,905 |
| 2018 | $2,743 | $95,417 | $14,512 | $80,905 |
| 2017 | $2,490 | $86,076 | $14,512 | $71,564 |
| 2016 | $2,246 | $84,919 | $14,512 | $70,407 |
| 2015 | $2,251 | $84,919 | $14,512 | $70,407 |
| 2014 | $2,255 | $84,919 | $14,512 | $70,407 |
| 2013 | -- | $88,546 | $18,140 | $70,406 |
Source: Public Records
Map
Nearby Homes
- 0 Kings Gap Rd Unit 10716981
- 2136 Hines Gap Rd
- 185 Royal Lodge Dr
- 5920 Kings Gap Rd
- 521 Cedar Dr W
- 216 Oak Dr
- 19110 Ga Highway 116
- 207 Westgate Cir
- 1251 S L St
- 299 S L St
- 2.83 ACRES Williams Rd
- 21401 Ga Highway 116
- 0 Oak Mountain Rd Unit 230706
- 114 Sourwood Dr
- 36 Sourwood Dr
- 121 Oak Cir
- 0 Brown Creek Rd Unit 10702900
- 520 Copeland Rd
- 2.03 Acres Johnson Mill Rd
- 2952 County Line Church Rd
- 324 Hines Gap Rd
- 402 Hines Gap Rd
- 424 Hines Gap Rd
- 124 Hines Gap Rd
- 86 Hines Gap Rd
- 485 Trammell Mill Rd
- 512 Hines Gap Rd
- 1980 N X St
- 401 Trammell Mill Rd
- 311 Hines Gap Rd
- 680 Trammell Mill Rd
- 400 Trammell Mill Rd
- 1678 N X St
- 334 Trammell Mill Rd
- 624 Hines Gap Rd
- 300 Trammell Mill Rd
- 380 Trammell Mill Rd
- 832 Trammell Mill Rd
- 721 Hines Gap Rd
- 799 Hines Gap Rd
Your Personal Tour Guide
Ask me questions while you tour the home.