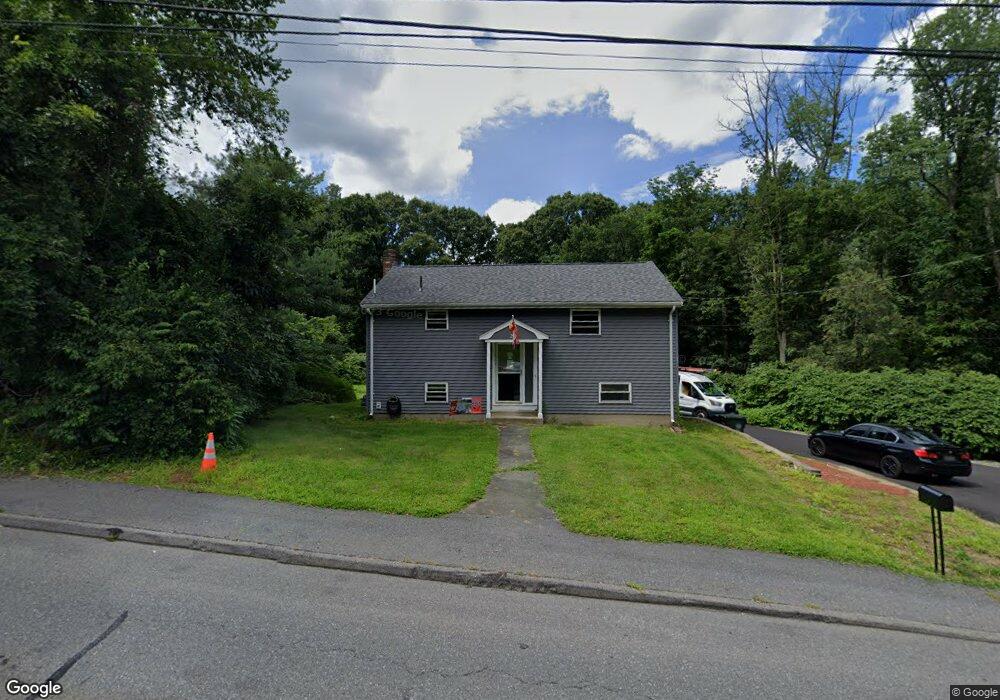
290 Hudson St Marlborough, MA 01752
Estimated Value: $554,000 - $732,832
2
Beds
2
Baths
1,392
Sq Ft
$448/Sq Ft
Est. Value
About This Home
This home is located at 290 Hudson St, Marlborough, MA 01752 and is currently estimated at $623,208, approximately $447 per square foot. 290 Hudson St is a home located in Middlesex County with nearby schools including Marlborough High School, New Covenant Christian School, and First Steps Children's Center.
Ownership History
Date
Name
Owned For
Owner Type
Purchase Details
Closed on
Apr 24, 2024
Sold by
Mcginley Thomas
Bought by
Mcginley Thomas and Mcdonald Sheila
Current Estimated Value
Purchase Details
Closed on
Sep 29, 2004
Sold by
Blais Michelle D
Bought by
Mcginley Thomas
Home Financials for this Owner
Home Financials are based on the most recent Mortgage that was taken out on this home.
Original Mortgage
$289,060
Interest Rate
5.81%
Mortgage Type
Purchase Money Mortgage
Purchase Details
Closed on
Dec 23, 1992
Sold by
Bigelow Edward L and Bigelow Lucie J
Bought by
Blais Michelle D
Purchase Details
Closed on
Dec 10, 1992
Sold by
Est Stone Marion K
Bought by
Bigelow Edward L and Bigelow Lucie J
Create a Home Valuation Report for This Property
The Home Valuation Report is an in-depth analysis detailing your home's value as well as a comparison with similar homes in the area
Home Values in the Area
Average Home Value in this Area
Purchase History
| Date | Buyer | Sale Price | Title Company |
|---|---|---|---|
| Mcginley Thomas | -- | None Available | |
| Mcginley Thomas | -- | None Available | |
| Mcginley Thomas | $298,000 | -- | |
| Mcginley Thomas | $298,000 | -- | |
| Blais Michelle D | $125,000 | -- | |
| Blais Michelle D | $125,000 | -- | |
| Bigelow Edward L | $125,000 | -- | |
| Bigelow Edward L | $125,000 | -- |
Source: Public Records
Mortgage History
| Date | Status | Borrower | Loan Amount |
|---|---|---|---|
| Previous Owner | Mcginley Thomas | $289,060 | |
| Previous Owner | Bigelow Edward L | $50,000 | |
| Previous Owner | Bigelow Edward L | $88,400 |
Source: Public Records
Tax History Compared to Growth
Tax History
| Year | Tax Paid | Tax Assessment Tax Assessment Total Assessment is a certain percentage of the fair market value that is determined by local assessors to be the total taxable value of land and additions on the property. | Land | Improvement |
|---|---|---|---|---|
| 2025 | $5,761 | $584,300 | $216,500 | $367,800 |
| 2024 | $5,329 | $520,400 | $196,900 | $323,500 |
| 2023 | $5,267 | $456,400 | $160,000 | $296,400 |
| 2022 | $4,310 | $328,500 | $152,400 | $176,100 |
| 2021 | $7,375 | $295,400 | $124,200 | $171,200 |
| 2020 | $4,783 | $284,800 | $121,000 | $163,800 |
| 2019 | $3,938 | $279,900 | $118,600 | $161,300 |
| 2018 | $6,527 | $275,000 | $101,700 | $173,300 |
| 2017 | $3,809 | $248,600 | $99,500 | $149,100 |
| 2016 | $3,467 | $226,000 | $99,500 | $126,500 |
| 2015 | $3,223 | $204,500 | $101,600 | $102,900 |
Source: Public Records
Map
Nearby Homes
- 315 Bolton St
- 4 Quinn Rd
- 67 Hunter Ave
- 656 Bolton St
- 71 Hudson St
- 53 Russell St
- 211 Stevens St
- 132 Prospect St
- 82 Brimsmead St
- 164 Stevens St
- 27 Jefferson St
- 27 Jefferson St Unit 204
- 110 Prospect St
- 29 Elm St
- 18 Brimsmead St
- 52 Norwood St
- 582 Pleasant St
- 73 Howland St
- 272 Lincoln St Unit 102
- 272 Lincoln St Unit 101