290 Jay Bird Ln Springtown, TX 76082
Estimated Value: $451,000 - $542,424
4
Beds
2
Baths
2,460
Sq Ft
$202/Sq Ft
Est. Value
About This Home
This home is located at 290 Jay Bird Ln, Springtown, TX 76082 and is currently estimated at $496,712, approximately $201 per square foot. 290 Jay Bird Ln is a home located in Parker County with nearby schools including Springtown Reno Elementary School, Springtown Intermediate School, and Springtown Middle School.
Ownership History
Date
Name
Owned For
Owner Type
Purchase Details
Closed on
Aug 4, 2025
Sold by
Elkins Truman Ray and Elkins Lisa Gay
Bought by
Elkins Truman Ray and Gay Mccallis Elkins Lisa
Current Estimated Value
Purchase Details
Closed on
Apr 30, 2010
Sold by
Knapp Jeanne and Allen Steven
Bought by
Elkins Truman and Elkins Lisa
Purchase Details
Closed on
Oct 11, 2006
Sold by
Johnson Russell E and Johnson Kimberly K
Bought by
Knapp Jeanne and Allen Steve
Home Financials for this Owner
Home Financials are based on the most recent Mortgage that was taken out on this home.
Original Mortgage
$164,000
Interest Rate
6.44%
Mortgage Type
New Conventional
Purchase Details
Closed on
Mar 12, 1998
Bought by
Elkins Truman and Elkins Lisa
Purchase Details
Closed on
Dec 5, 1994
Bought by
Elkins Truman and Elkins Lisa
Purchase Details
Closed on
Aug 12, 1988
Bought by
Elkins Truman and Elkins Lisa
Create a Home Valuation Report for This Property
The Home Valuation Report is an in-depth analysis detailing your home's value as well as a comparison with similar homes in the area
Home Values in the Area
Average Home Value in this Area
Purchase History
| Date | Buyer | Sale Price | Title Company |
|---|---|---|---|
| Elkins Truman Ray | -- | None Listed On Document | |
| Elkins Truman | -- | None Available | |
| Knapp Jeanne | -- | Dhi Title Co | |
| Elkins Truman | -- | -- | |
| Elkins Truman | -- | -- | |
| Elkins Truman | -- | -- |
Source: Public Records
Mortgage History
| Date | Status | Borrower | Loan Amount |
|---|---|---|---|
| Previous Owner | Knapp Jeanne | $164,000 | |
| Closed | Elkins Truman | $0 |
Source: Public Records
Tax History Compared to Growth
Tax History
| Year | Tax Paid | Tax Assessment Tax Assessment Total Assessment is a certain percentage of the fair market value that is determined by local assessors to be the total taxable value of land and additions on the property. | Land | Improvement |
|---|---|---|---|---|
| 2025 | $1,105 | $173,695 | -- | -- |
| 2024 | $1,105 | $155,177 | -- | -- |
| 2023 | $1,105 | $141,070 | $0 | $0 |
| 2022 | $2,254 | $206,780 | $25,000 | $181,780 |
| 2021 | $2,225 | $206,780 | $25,000 | $181,780 |
| 2020 | $2,016 | $104,490 | $16,000 | $88,490 |
| 2019 | $2,167 | $104,490 | $16,000 | $88,490 |
| 2018 | $2,842 | $136,630 | $6,840 | $129,790 |
| 2017 | $2,786 | $136,630 | $6,840 | $129,790 |
| 2016 | $2,533 | $116,190 | $6,840 | $109,350 |
| 2015 | $2,081 | $116,190 | $6,840 | $109,350 |
| 2014 | $2,026 | $103,170 | $6,840 | $96,330 |
Source: Public Records
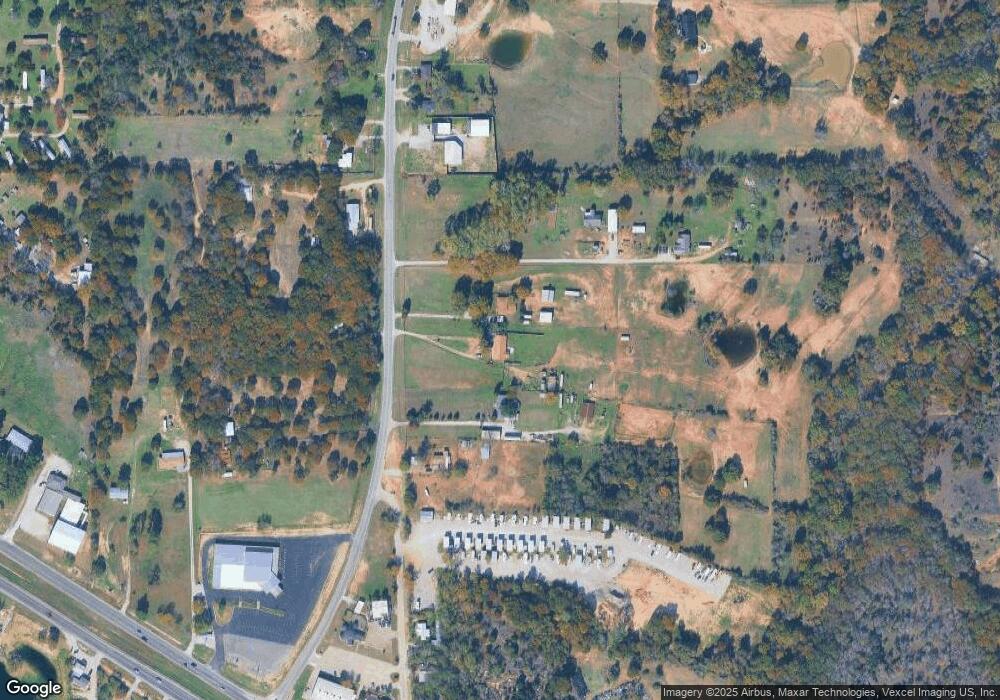
Map
Nearby Homes
- 3737 E Highway 199
- 100 Cora Ct
- 328 Creekview Meadows Dr
- 289 Belle Place
- 150 Oak Valley Ln
- 1305 Hutchins Ln
- 1303 Hutchins Ln
- 144 Oak Meadows Dr
- 3420 Springfield Rd
- 4861 E Highway 199
- 105 Billabong Ct
- 134 Classic Country Ct
- 109 Coolibar Ct
- 406 Hilltop Meadows Ct
- 124 Sunny Dale Ct
- 550 New Highland Rd
- 725 S Reno Rd
- 1020 Jesse James Ln
- 128 Arunda Ct
- 1610 Newsom Mound Rd
- 300 Jay Bird Ln
- 214 Jay Bird Ln
- 420 Jay Bird Ln
- 330 Jay Bird Ln
- 330 Jay Bird Ln
- 440 Jay Bird Ln
- 425 Jay Bird Ln
- 444 Jay Bird Ln
- 130 Jay Bird Ln
- 150 Jay Bird Ln Unit Bldg 3
- 150 Jay Bird Ln
- 128 Jay Bird Cut Off Rd
- 128 Jay Bird Cut Off Rd
- 209 Jay Bird Ln
- 391 Jay Bird Ln
- 451 Jay Bird Ln
- 120 Jay Bird Cut Off Rd
- 3605 E Highway 199
- 506 Jay Bird Ln
- 544 Jay Bird Ln