Estimated Value: $343,781
About This Home
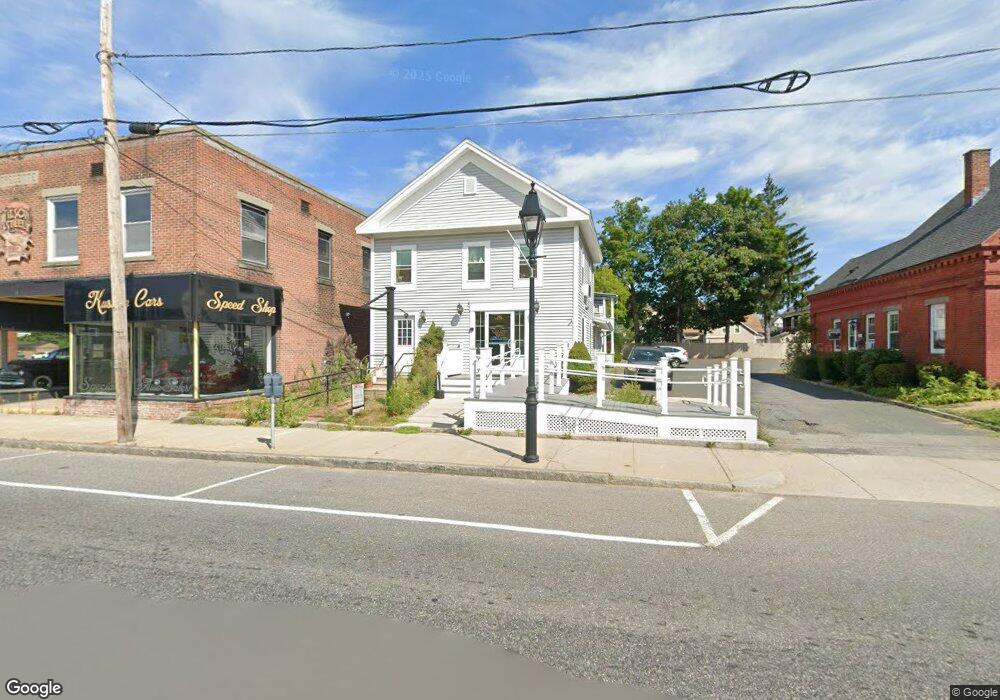
This home is located at 290 Main St, Athol, MA 01331 and is currently priced at $343,781, approximately $185 per square foot. 290 Main St is a home located in Worcester County with nearby schools including Athol High School.
Ownership History
We collect this data history from publicly available records. To have your information removed, we recommend requesting removal directly through your county’s website.
Purchase Details
Home Financials for this Owner
Home Financials are based on the most recent Mortgage that was taken out on this home.Purchase Details
Home Financials for this Owner
Home Financials are based on the most recent Mortgage that was taken out on this home.Purchase Details
Home Financials for this Owner
Home Financials are based on the most recent Mortgage that was taken out on this home.Home Values in the Area
Average Home Value in this Area
Purchase History
We collect this data history from publicly available records. To have your information removed, we recommend requesting removal directly through your county’s website.
| Date | Buyer | Sale Price | Title Company |
|---|---|---|---|
| $99,400 | -- | ||
| $155,000 | -- | ||
| $155,000 | -- | ||
| $74,500 | -- |
Mortgage History
We collect this data history from publicly available records. To have your information removed, we recommend requesting removal directly through your county’s website.
| Date | Status | Borrower | Loan Amount |
|---|---|---|---|
| Open | $550,000 | ||
| Previous Owner | $110,000 | ||
| Previous Owner | $56,000 |
Tax History
We collect this data history from publicly available records. To have your information removed, we recommend requesting removal directly through your county’s website.
| Year | Tax Paid | Tax Assessment Tax Assessment Total Assessment is a certain percentage of the fair market value that is determined by local assessors to be the total taxable value of land and additions on the property. | Land | Improvement |
|---|---|---|---|---|
| 2025 | $3,170 | $249,400 | $85,900 | $163,500 |
| 2024 | $2,461 | $191,800 | $81,800 | $110,000 |
| 2023 | $2,376 | $169,200 | $59,200 | $110,000 |
| 2022 | $2,716 | $169,200 | $59,200 | $110,000 |
| 2021 | $2,218 | $125,600 | $38,000 | $87,600 |
| 2020 | $2,158 | $125,600 | $38,000 | $87,600 |
| 2019 | $2,192 | $125,600 | $38,000 | $87,600 |
| 2018 | $2,384 | $121,800 | $34,200 | $87,600 |
| 2017 | $1,991 | $97,600 | $34,200 | $63,400 |
| 2016 | $1,886 | $95,100 | $34,100 | $61,000 |
| 2015 | $1,810 | $95,100 | $34,100 | $61,000 |
| 2014 | $1,753 | $95,100 | $34,100 | $61,000 |
Map
- 189 Walnut St
- 207 Walnut St
- 30 Dunbar Place
- 280 Main St
- 180 Walnut St
- 217 Walnut St
- 200 Walnut St
- 18 Dunbar Place
- 168 Walnut St
- 168 Walnut St Unit 3
- 168 Walnut St Unit 1
- 168 Walnut St Unit 2
- 158 Walnut St
- 212 Walnut St
- 225 Walnut St
- 160 Walnut St
- 304 Main St
- 304 Main St Unit 2
- 143 Walnut St
- 222 Walnut St
Ask me questions while you tour the home.