290 Moraga Way Orinda, CA 94563
Crestview NeighborhoodEstimated Value: $2,442,000 - $2,973,092
About This Home
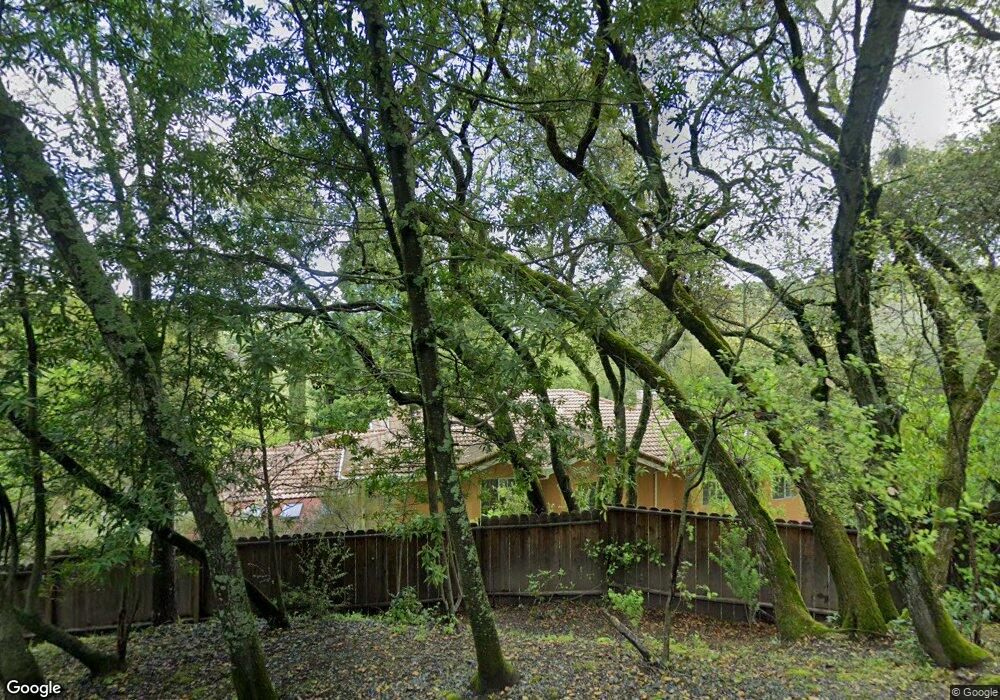
This home is located at 290 Moraga Way, Orinda, CA 94563 and is currently estimated at $2,696,273, approximately $604 per square foot. 290 Moraga Way is a home located in Contra Costa County with nearby schools including Del Rey Elementary School, Orinda Intermediate School, and Miramonte High School.
Ownership History
We collect this data history from publicly available records. To have your information removed, we recommend requesting removal directly through your county’s website.
Purchase Details
Home Financials for this Owner
Home Financials are based on the most recent Mortgage that was taken out on this home.Purchase Details
Home Financials for this Owner
Home Financials are based on the most recent Mortgage that was taken out on this home.Home Values in the Area
Average Home Value in this Area
Purchase History
We collect this data history from publicly available records. To have your information removed, we recommend requesting removal directly through your county’s website.
| Date | Buyer | Sale Price | Title Company |
|---|---|---|---|
| -- | None Available | ||
| -- | Chicago Title Company |
Mortgage History
We collect this data history from publicly available records. To have your information removed, we recommend requesting removal directly through your county’s website.
| Date | Status | Borrower | Loan Amount |
|---|---|---|---|
| Closed | $512,000 |
Tax History
We collect this data history from publicly available records. To have your information removed, we recommend requesting removal directly through your county’s website.
| Year | Tax Paid | Tax Assessment Tax Assessment Total Assessment is a certain percentage of the fair market value that is determined by local assessors to be the total taxable value of land and additions on the property. | Land | Improvement |
|---|---|---|---|---|
| 2025 | $13,404 | $996,584 | $260,049 | $736,535 |
| 2024 | $12,978 | $977,044 | $254,950 | $722,094 |
| 2023 | $12,978 | $957,887 | $249,951 | $707,936 |
| 2022 | $12,539 | $939,105 | $245,050 | $694,055 |
| 2021 | $12,290 | $920,693 | $240,246 | $680,447 |
| 2019 | $12,123 | $893,386 | $233,121 | $660,265 |
| 2018 | $11,215 | $875,869 | $228,550 | $647,319 |
| 2017 | $10,902 | $858,696 | $224,069 | $634,627 |
| 2016 | $10,638 | $841,860 | $219,676 | $622,184 |
| 2015 | $10,576 | $829,216 | $216,377 | $612,839 |
| 2014 | $10,425 | $812,974 | $212,139 | $600,835 |
Map
- 19 Valley Dr
- 274 Orchard Rd
- 40 Hilldale Ct
- 78 Scenic Dr
- 31 Sandy Ct
- 128 Oak Rd
- 83 Dairy Creek Ln
- 38 Fiddleneck Way
- 11 Bigleaf Rd
- 1 Oakview Terrace
- 56 Camino Encinas
- 26 Oak Rd
- 115 Moraga Way
- 103 Barbara Rd
- 36 Lucille Way
- 30 Greenwood Ct
- 20 Lucille Way
- 26 Lucille Way
- 218 Overhill Rd
- 0 Parklane Dr Unit 41125580
Ask me questions while you tour the home.