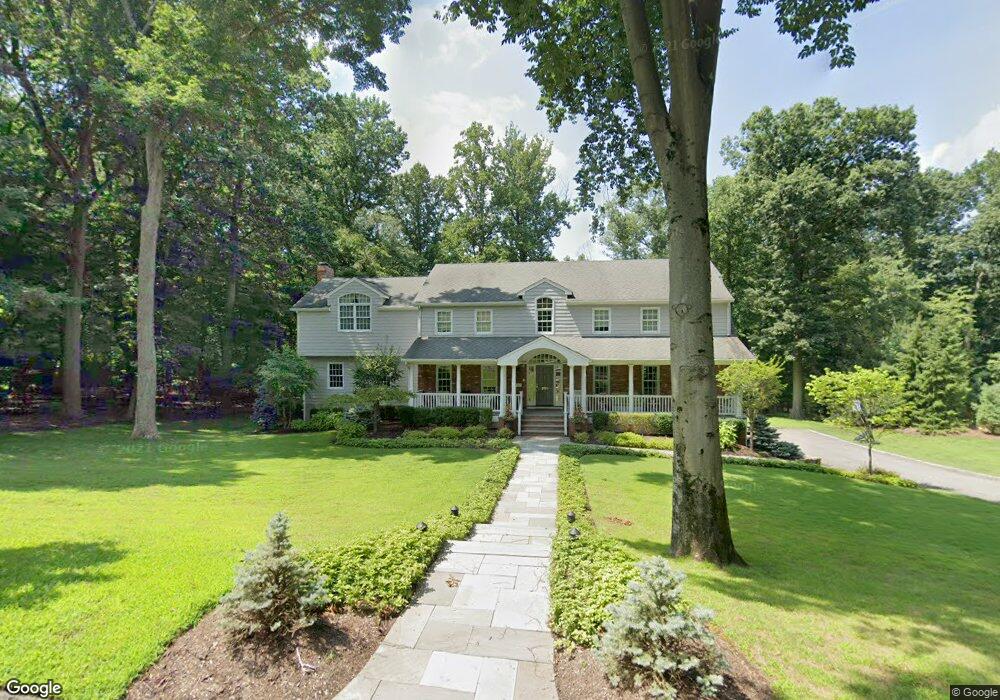
290 Myrtle St Haworth, NJ 07641
Estimated Value: $1,743,751 - $1,982,000
--
Bed
--
Bath
3,798
Sq Ft
$489/Sq Ft
Est. Value
About This Home
This home is located at 290 Myrtle St, Haworth, NJ 07641 and is currently estimated at $1,857,688, approximately $489 per square foot. 290 Myrtle St is a home located in Bergen County with nearby schools including Haworth Elementary School, Northern Valley Regional High School at Demarest, and St. Joseph School.
Ownership History
Date
Name
Owned For
Owner Type
Purchase Details
Closed on
Oct 31, 2000
Sold by
Bliss Harlan B
Bought by
Welish Steven and Davidson Melissa
Current Estimated Value
Home Financials for this Owner
Home Financials are based on the most recent Mortgage that was taken out on this home.
Original Mortgage
$600,000
Outstanding Balance
$220,299
Interest Rate
7.83%
Estimated Equity
$1,637,389
Create a Home Valuation Report for This Property
The Home Valuation Report is an in-depth analysis detailing your home's value as well as a comparison with similar homes in the area
Home Values in the Area
Average Home Value in this Area
Purchase History
| Date | Buyer | Sale Price | Title Company |
|---|---|---|---|
| Welish Steven | $750,000 | -- |
Source: Public Records
Mortgage History
| Date | Status | Borrower | Loan Amount |
|---|---|---|---|
| Open | Welish Steven | $600,000 |
Source: Public Records
Tax History Compared to Growth
Tax History
| Year | Tax Paid | Tax Assessment Tax Assessment Total Assessment is a certain percentage of the fair market value that is determined by local assessors to be the total taxable value of land and additions on the property. | Land | Improvement |
|---|---|---|---|---|
| 2025 | $34,816 | $1,126,000 | $381,000 | $745,000 |
| 2024 | $34,253 | $1,126,000 | $381,000 | $745,000 |
| 2023 | $33,544 | $1,126,000 | $381,000 | $745,000 |
| 2022 | $30,514 | $1,024,300 | $381,000 | $643,300 |
| 2021 | $30,155 | $1,024,300 | $381,000 | $643,300 |
| 2020 | $29,899 | $1,024,300 | $381,000 | $643,300 |
| 2019 | $29,817 | $1,024,300 | $381,000 | $643,300 |
| 2018 | $29,367 | $1,024,300 | $381,000 | $643,300 |
| 2017 | $29,531 | $1,024,300 | $381,000 | $643,300 |
| 2016 | $29,807 | $1,024,300 | $381,000 | $643,300 |
| 2015 | $28,629 | $1,024,300 | $381,000 | $643,300 |
| 2014 | $28,189 | $1,024,300 | $381,000 | $643,300 |
Source: Public Records
Map
Nearby Homes
- 390 Harland Ave
- 155 Maple St
- 308 Spring Ln
- 455 Sunset Ave
- 110 Mason Ct Unit 3H
- 226 Haworth Ave
- 259 Bedford Rd
- 34 Summit Place
- 88 Cedar Rd
- 130 Durie Ave
- 199 Whitman St
- 502 Prospect Ave
- 96 Wilkens Dr
- 214 Durie Ave
- 13 Poplar St
- 608 Fermery Dr
- 129 Knickerbocker Rd
- 51 Harrison St
- 45 Forest Rd
- 99 Old Hook Rd