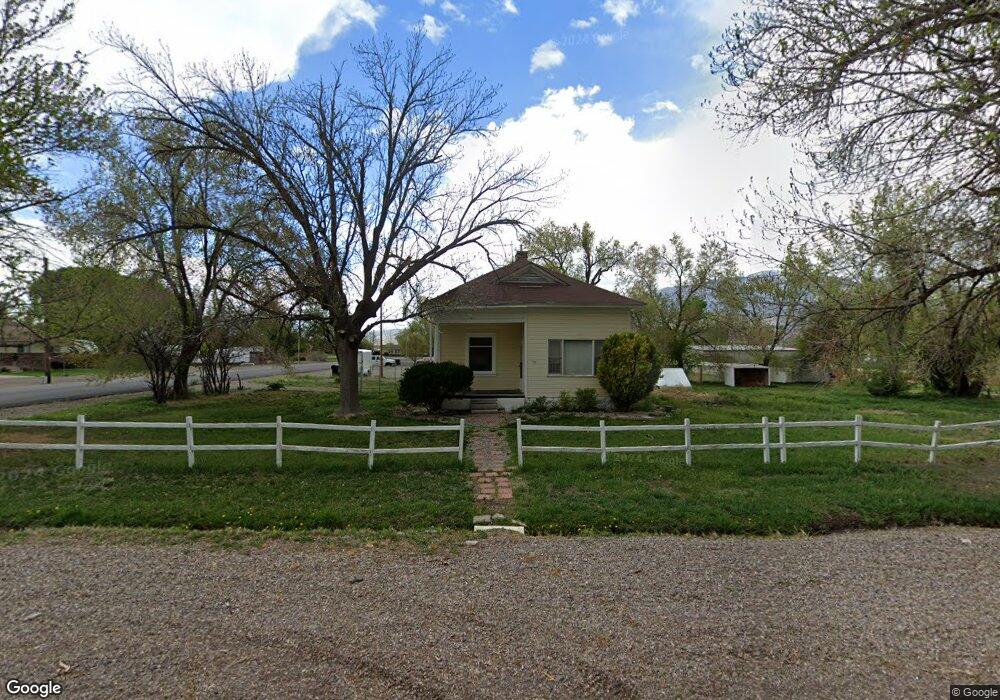
290 N 100 E Elsinore, UT 84754
Monroe NeighborhoodEstimated Value: $219,000 - $262,000
--
Bed
--
Bath
1,014
Sq Ft
$239/Sq Ft
Est. Value
About This Home
This home is located at 290 N 100 E, Elsinore, UT 84754 and is currently estimated at $242,668, approximately $239 per square foot. 290 N 100 E is a home with nearby schools including Monroe School, South Sevier Middle School, and South Sevier High School.
Ownership History
Date
Name
Owned For
Owner Type
Purchase Details
Closed on
Jun 10, 2020
Sold by
Beckes Ginny Edgel
Bought by
Miller Aubrilyn Marie
Current Estimated Value
Home Financials for this Owner
Home Financials are based on the most recent Mortgage that was taken out on this home.
Original Mortgage
$148,068
Outstanding Balance
$131,251
Interest Rate
3.2%
Mortgage Type
FHA
Estimated Equity
$111,417
Purchase Details
Closed on
Mar 14, 2008
Sold by
Hansen James V and Hansen Caarol Fae
Bought by
Beckes Rhiannon R
Home Financials for this Owner
Home Financials are based on the most recent Mortgage that was taken out on this home.
Original Mortgage
$63,500
Interest Rate
5.72%
Mortgage Type
Unknown
Purchase Details
Closed on
Dec 10, 2007
Sold by
Larson Neil G and Larson Ina D
Bought by
Hansen James V and Hansen Carol Fae
Purchase Details
Closed on
Nov 7, 2007
Sold by
Burns Robert Q
Bought by
Larson Neil G and Larson Ina D
Create a Home Valuation Report for This Property
The Home Valuation Report is an in-depth analysis detailing your home's value as well as a comparison with similar homes in the area
Home Values in the Area
Average Home Value in this Area
Purchase History
| Date | Buyer | Sale Price | Title Company |
|---|---|---|---|
| Miller Aubrilyn Marie | -- | 1St Liberty Title Lc | |
| Beckes Ginny Edgel | -- | 1St Liberty Title Lc | |
| Beckes Rhiannon R | -- | None Available | |
| Hansen James V | -- | D Land Title | |
| Larson Neil G | $39,365 | First American Title |
Source: Public Records
Mortgage History
| Date | Status | Borrower | Loan Amount |
|---|---|---|---|
| Open | Miller Aubrilyn Marie | $148,068 | |
| Previous Owner | Beckes Rhiannon R | $63,500 |
Source: Public Records
Tax History Compared to Growth
Tax History
| Year | Tax Paid | Tax Assessment Tax Assessment Total Assessment is a certain percentage of the fair market value that is determined by local assessors to be the total taxable value of land and additions on the property. | Land | Improvement |
|---|---|---|---|---|
| 2024 | $875 | $99,310 | $26,055 | $73,255 |
| 2023 | $875 | $90,064 | $23,235 | $66,829 |
| 2022 | $1,256 | $123,995 | $17,953 | $106,042 |
| 2021 | $842 | $68,690 | $15,655 | $53,035 |
| 2020 | $757 | $105,172 | $17,790 | $87,382 |
| 2019 | $578 | $86,310 | $17,790 | $68,520 |
| 2018 | $70 | $78,700 | $17,790 | $60,910 |
| 2017 | $594 | $41,190 | $9,780 | $31,410 |
| 2016 | $444 | $38,970 | $0 | $0 |
| 2015 | $444 | $38,970 | $0 | $0 |
| 2014 | $444 | $38,970 | $0 | $0 |
Source: Public Records
Map
Nearby Homes