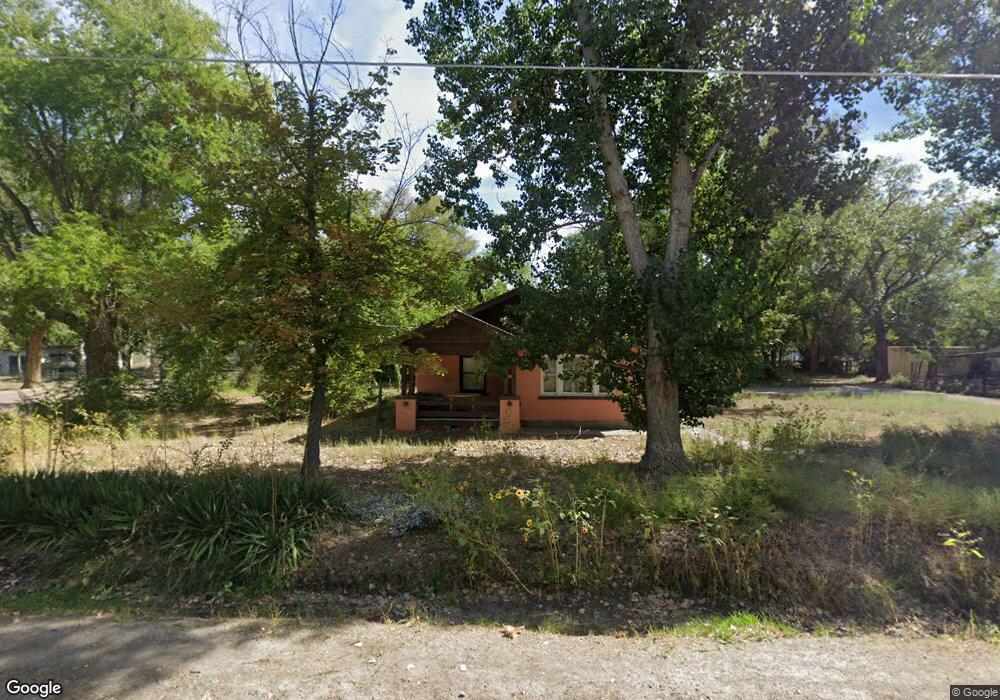
290 N 100 E Hinckley, UT 84635
Estimated Value: $130,000 - $203,000
2
Beds
1
Bath
735
Sq Ft
$238/Sq Ft
Est. Value
About This Home
This home is located at 290 N 100 E, Hinckley, UT 84635 and is currently estimated at $175,022, approximately $238 per square foot. 290 N 100 E is a home located in Millard County.
Ownership History
Date
Name
Owned For
Owner Type
Purchase Details
Closed on
Feb 19, 2020
Sold by
Pleasant Manor Llc
Bought by
Stevens Curtis J
Current Estimated Value
Home Financials for this Owner
Home Financials are based on the most recent Mortgage that was taken out on this home.
Original Mortgage
$51,858
Outstanding Balance
$45,819
Interest Rate
3.6%
Mortgage Type
New Conventional
Estimated Equity
$129,203
Purchase Details
Closed on
Feb 18, 2020
Sold by
Stevens Curtis J
Bought by
Olene Walker Housing Loan Fund
Home Financials for this Owner
Home Financials are based on the most recent Mortgage that was taken out on this home.
Original Mortgage
$51,858
Outstanding Balance
$45,819
Interest Rate
3.6%
Mortgage Type
New Conventional
Estimated Equity
$129,203
Purchase Details
Closed on
Jan 24, 2019
Sold by
Orange Title Insurance Agency Inc
Bought by
Pleasant Manor Llc
Purchase Details
Closed on
Jul 17, 2014
Sold by
Marilyn Marilyn
Bought by
Evans David K
Home Financials for this Owner
Home Financials are based on the most recent Mortgage that was taken out on this home.
Original Mortgage
$41,850
Interest Rate
4.12%
Mortgage Type
Stand Alone First
Create a Home Valuation Report for This Property
The Home Valuation Report is an in-depth analysis detailing your home's value as well as a comparison with similar homes in the area
Purchase History
| Date | Buyer | Sale Price | Title Company |
|---|---|---|---|
| Stevens Curtis J | -- | First American Title | |
| Olene Walker Housing Loan Fund | $23,220 | First American Title | |
| Pleasant Manor Llc | $37,930 | None Available | |
| Evans David K | -- | First American Title Insur |
Source: Public Records
Mortgage History
| Date | Status | Borrower | Loan Amount |
|---|---|---|---|
| Open | Stevens Curtis J | $51,858 | |
| Previous Owner | Evans David K | $41,850 |
Source: Public Records
Tax History
| Year | Tax Paid | Tax Assessment Tax Assessment Total Assessment is a certain percentage of the fair market value that is determined by local assessors to be the total taxable value of land and additions on the property. | Land | Improvement |
|---|---|---|---|---|
| 2025 | $727 | $86,257 | $15,824 | $70,433 |
| 2024 | $727 | $78,761 | $5,946 | $72,815 |
| 2023 | $860 | $78,761 | $5,946 | $72,815 |
| 2022 | $562 | $47,191 | $5,198 | $41,993 |
| 2021 | $457 | $36,525 | $4,331 | $32,194 |
| 2020 | $358 | $28,544 | $4,125 | $24,419 |
| 2019 | $355 | $28,544 | $4,125 | $24,419 |
| 2018 | $346 | $28,544 | $4,125 | $24,419 |
| 2017 | $352 | $27,833 | $4,125 | $23,708 |
| 2016 | $337 | $27,833 | $4,125 | $23,708 |
| 2015 | $326 | $26,802 | $4,125 | $22,677 |
| 2014 | -- | $27,471 | $4,125 | $23,346 |
| 2013 | -- | $26,792 | $4,125 | $22,667 |
Source: Public Records
Map
Nearby Homes
- 289 W Center St S
- 291 W Center St
- 30 S 800 West Rd
- 861 W 75 S
- 700 Acres
- 1500 S 10000 W
- 6000 N 10000 W
- 7560 W 8500 N
- 4500 N 10000 W
- 850 W 15900 N
- 4500 N 9000 W
- 700 Acres Hwy 6 & Main St (Hwy 50)
- 2000 E 10500 N
- 6200 S 3000 W
- 18000 W Hwy 50 6
- 3480 S 4000 W
- 6177 S 3000 Rd W
- 4265 S 4000 W
- 3885 W 4500 S
- Tbd 7000 W Rd
Your Personal Tour Guide
Ask me questions while you tour the home.