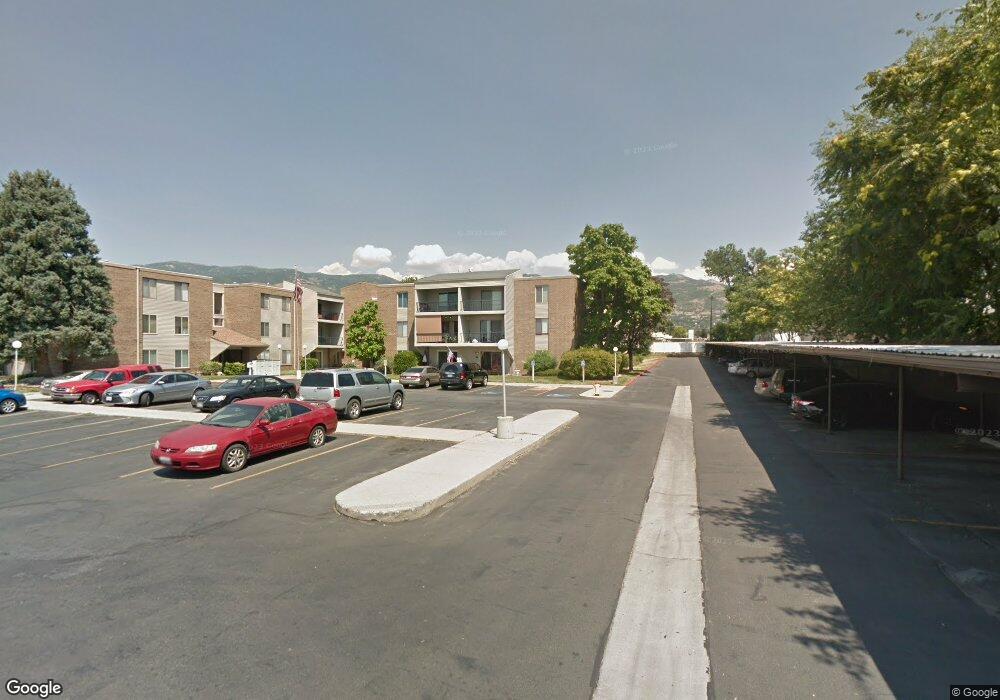
290 N 500 W Bountiful, UT 84010
Estimated Value: $266,000 - $337,000
2
Beds
1
Bath
1,043
Sq Ft
$276/Sq Ft
Est. Value
About This Home
This home is located at 290 N 500 W, Bountiful, UT 84010 and is currently estimated at $288,208, approximately $276 per square foot. 290 N 500 W is a home located in Davis County with nearby schools including Meadowbrook Elementary School, Bountiful Junior High School, and Bountiful High School.
Ownership History
Date
Name
Owned For
Owner Type
Purchase Details
Closed on
Apr 20, 2023
Sold by
Airmet Tannon
Bought by
Rembacz Andrew and Rembacz Breanna
Current Estimated Value
Home Financials for this Owner
Home Financials are based on the most recent Mortgage that was taken out on this home.
Original Mortgage
$271,600
Outstanding Balance
$264,229
Interest Rate
6.73%
Mortgage Type
New Conventional
Estimated Equity
$23,979
Purchase Details
Closed on
Aug 6, 2019
Sold by
Earl Alexander
Bought by
Airmet Tannon
Home Financials for this Owner
Home Financials are based on the most recent Mortgage that was taken out on this home.
Original Mortgage
$159,080
Interest Rate
3.73%
Mortgage Type
New Conventional
Purchase Details
Closed on
Mar 21, 2013
Sold by
Rigby Jannetta P
Bought by
Jolley Parker and Jolley Kayleigh
Purchase Details
Closed on
Nov 3, 1997
Sold by
Bmx 97 Inc
Bought by
Rigby Jannetta P
Create a Home Valuation Report for This Property
The Home Valuation Report is an in-depth analysis detailing your home's value as well as a comparison with similar homes in the area
Purchase History
| Date | Buyer | Sale Price | Title Company |
|---|---|---|---|
| Rembacz Andrew | -- | None Listed On Document | |
| Airmet Tannon | -- | Real Advantage Title | |
| Jolley Parker | -- | Backman Title Servi | |
| Rigby Jannetta P | -- | First American Title Co |
Source: Public Records
Mortgage History
| Date | Status | Borrower | Loan Amount |
|---|---|---|---|
| Open | Rembacz Andrew | $271,600 | |
| Previous Owner | Airmet Tannon | $159,080 |
Source: Public Records
Tax History
| Year | Tax Paid | Tax Assessment Tax Assessment Total Assessment is a certain percentage of the fair market value that is determined by local assessors to be the total taxable value of land and additions on the property. | Land | Improvement |
|---|---|---|---|---|
| 2025 | $1,395 | $138,050 | $48,950 | $89,100 |
| 2024 | $1,356 | $136,400 | $54,450 | $81,950 |
| 2023 | $1,231 | $224,000 | $93,000 | $131,000 |
| 2022 | $1,220 | $121,550 | $32,450 | $89,100 |
| 2021 | $1,153 | $176,000 | $46,000 | $130,000 |
| 2020 | $1,049 | $162,000 | $42,600 | $119,400 |
| 2019 | $1,015 | $153,000 | $39,000 | $114,000 |
| 2018 | $845 | $126,000 | $36,000 | $90,000 |
| 2016 | $677 | $54,615 | $9,900 | $44,715 |
| 2015 | $612 | $46,695 | $9,900 | $36,795 |
| 2014 | $524 | $40,929 | $18,333 | $22,596 |
| 2013 | -- | $50,140 | $13,200 | $36,940 |
Source: Public Records
Map
Nearby Homes
- 290 N 500 W Unit 305
- 399 W 400 N Unit 47
- 401 W 400 N Unit 49
- 332 N 300 W
- 75 N Peregrine Ln W Unit 8
- 499 N 200 W Unit 30
- 320 N 200 W Unit 4
- 563 N 200 W
- 790 N 500 W
- 366 W 1000 N
- 106 W 700 N
- 184 Park Shadows Cir
- 93 W 700 N
- 252 N Main St
- 256 N Main St
- 254 N Main St
- 51 E 200 N Unit 3
- 55 E 200 N Unit 2
- 41 E 200 N Unit 6
- 49 E 200 N Unit 4
- 290 N 500 W Unit 315
- 290 N 500 W
- 290 N 500 W Unit 313
- 290 N 500 W Unit 312
- 290 N 500 W Unit 311
- 290 N 500 W Unit 310
- 290 N 500 W Unit 309
- 290 N 500 W Unit 308
- 290 N 500 W Unit 307
- 290 N 500 W Unit 306
- 290 N 500 W
- 290 N 500 W
- 290 N 500 W Unit 301
- 290 N 500 W Unit 216
- 290 N 500 W Unit 215
- 290 N 500 W
- 290 N 500 W Unit 213
- 290 N 500 W Unit 212
- 290 N 500 W
- 290 N 500 W
Your Personal Tour Guide
Ask me questions while you tour the home.