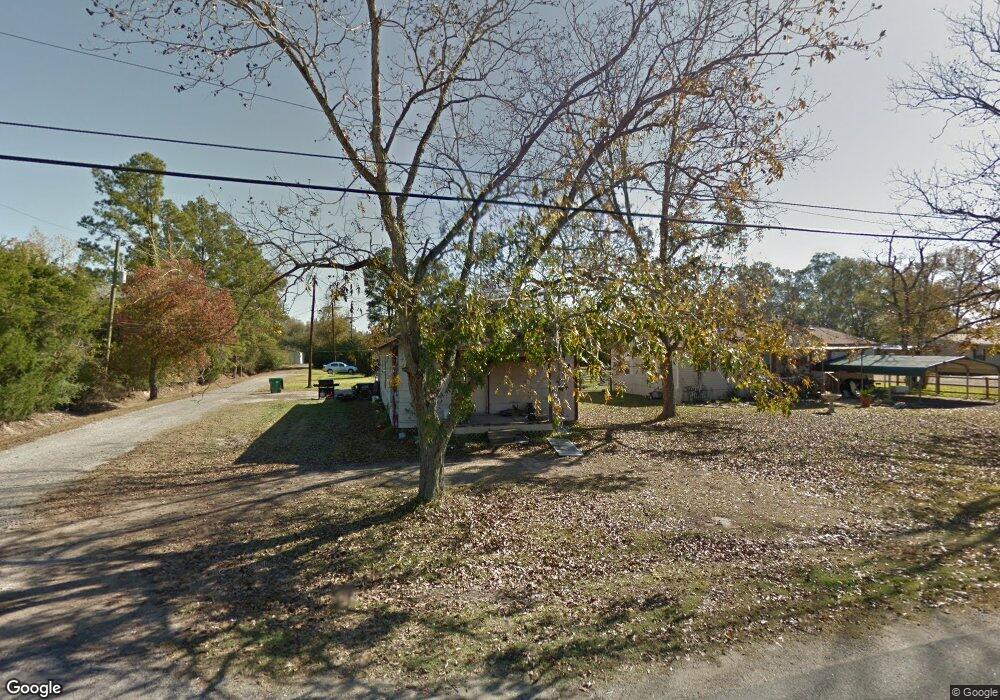
290 N Merchant St Sour Lake, TX 77659
Pinewood Estates NeighborhoodEstimated Value: $137,000 - $222,000
3
Beds
2
Baths
1,413
Sq Ft
$138/Sq Ft
Est. Value
About This Home
This home is located at 290 N Merchant St, Sour Lake, TX 77659 and is currently estimated at $194,401, approximately $137 per square foot. 290 N Merchant St is a home located in Hardin County with nearby schools including Hardin-Jefferson Junior High School and Hardin-Jefferson High School.
Ownership History
Date
Name
Owned For
Owner Type
Purchase Details
Closed on
Sep 3, 2024
Sold by
Goldman Jeremy and Goldman Jeremy L
Bought by
Manuel Haley Elizabeth and Manuel Kevin Joseph
Current Estimated Value
Home Financials for this Owner
Home Financials are based on the most recent Mortgage that was taken out on this home.
Original Mortgage
$216,015
Outstanding Balance
$213,722
Interest Rate
6.77%
Mortgage Type
FHA
Estimated Equity
-$19,321
Purchase Details
Closed on
Feb 2, 2023
Sold by
Milam Doretha
Bought by
Goldman Jeremy L
Create a Home Valuation Report for This Property
The Home Valuation Report is an in-depth analysis detailing your home's value as well as a comparison with similar homes in the area
Home Values in the Area
Average Home Value in this Area
Purchase History
| Date | Buyer | Sale Price | Title Company |
|---|---|---|---|
| Manuel Haley Elizabeth | -- | Capital Title | |
| Goldman Jeremy L | -- | None Listed On Document |
Source: Public Records
Mortgage History
| Date | Status | Borrower | Loan Amount |
|---|---|---|---|
| Open | Manuel Haley Elizabeth | $216,015 |
Source: Public Records
Tax History Compared to Growth
Tax History
| Year | Tax Paid | Tax Assessment Tax Assessment Total Assessment is a certain percentage of the fair market value that is determined by local assessors to be the total taxable value of land and additions on the property. | Land | Improvement |
|---|---|---|---|---|
| 2024 | $82 | $4,193 | $1,265 | $4,169 |
| 2023 | $19 | $3,812 | $1,265 | $4,169 |
| 2022 | $77 | $4,183 | $1,265 | $2,918 |
| 2021 | $75 | $3,340 | $1,260 | $2,080 |
| 2020 | $68 | $2,860 | $1,260 | $1,600 |
| 2019 | $926 | $37,500 | $1,260 | $36,240 |
| 2018 | $450 | $37,500 | $1,260 | $36,240 |
| 2017 | $827 | $37,500 | $1,260 | $36,240 |
| 2016 | $934 | $37,500 | $1,260 | $36,240 |
| 2015 | $306 | $27,420 | $1,260 | $26,160 |
| 2014 | $462 | $31,300 | $1,260 | $30,040 |
Source: Public Records
Map
Nearby Homes
- 510 Moye
- 000 Moye
- 517 N Merchant St
- 470 N Ann St
- 1555 Holly Trail
- 320 Tomlinson St
- 240 S Merchant St
- 270 Railroad St
- 280 Railroad St
- 765 W Herring St
- 310 W Hartel St
- 235 W Hartel St
- 175 W Hartel St
- 730 Lee St
- TBD Texas 326
- 140 W Hooks St
- 895 Clifford Rd
- 235 W Barfield St
- 190 W Barfield St
- 210 Gilbert St